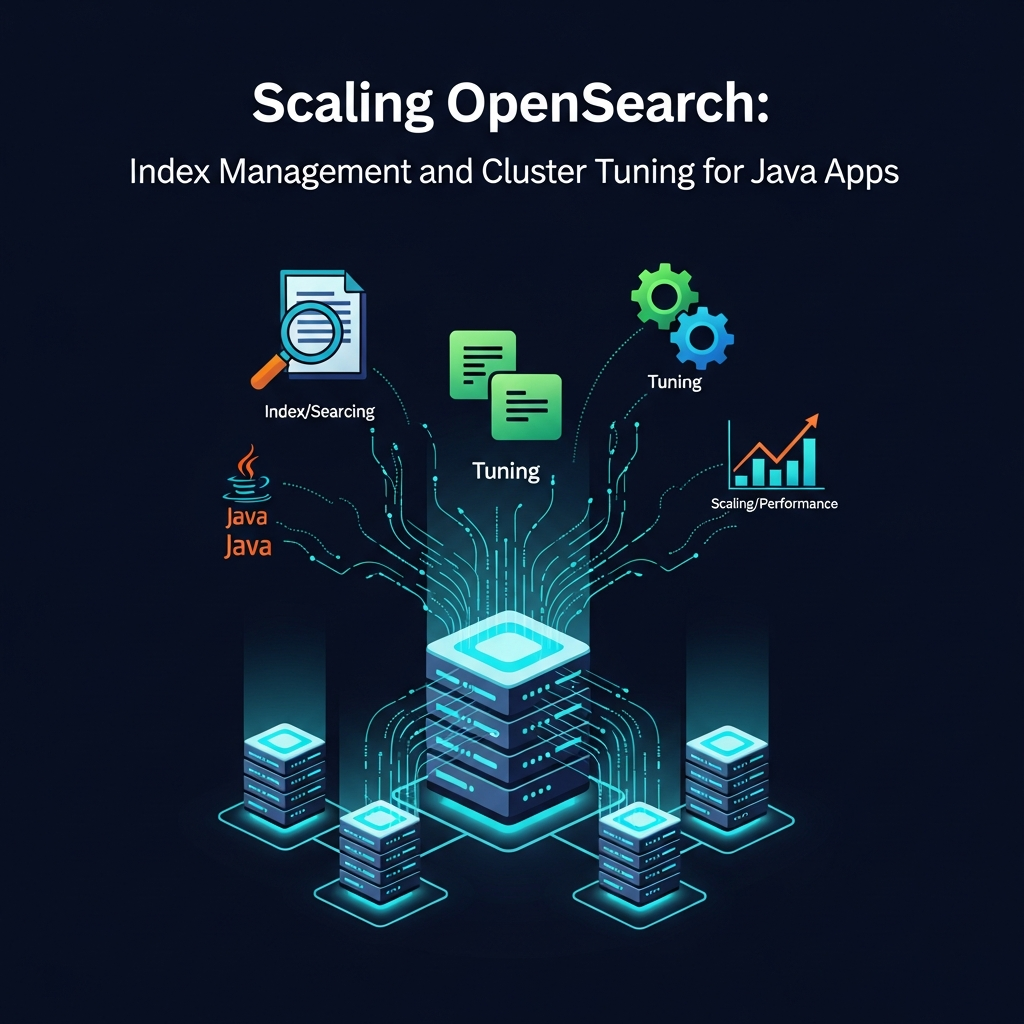
Scaling OpenSearch: Index Management & Cluster Tuning for Java Apps

Introduction
In the world of modern Java applications, data reigns supreme. From user activity logs to product catalogs and analytical metrics, applications generate and consume vast amounts of information. OpenSearch, a powerful, open-source search and analytics suite, often serves as the backbone for storing, indexing, and querying this data at scale. However, merely deploying OpenSearch isn't enough; as data volumes grow and query loads intensify, performance bottlenecks, slow searches, and escalating infrastructure costs can quickly emerge.
This comprehensive guide is designed for Java developers and DevOps engineers who aim to master OpenSearch scalability. We'll dive deep into practical strategies for effective index management and meticulous cluster tuning, specifically tailored to optimize OpenSearch clusters backing high-performance Java applications. By the end, you'll possess the knowledge to build and maintain a robust, efficient, and cost-effective OpenSearch environment that can effortlessly handle your application's evolving data demands.
Prerequisites
To get the most out of this guide, you should have:
- A basic understanding of OpenSearch concepts, including indices, documents, shards, and clusters.
- Familiarity with Java and common frameworks like Spring Boot.
- Access to an OpenSearch cluster (local, self-managed, or cloud-hosted) for practical experimentation.
- Basic knowledge of REST APIs and JSON.
1. Understanding OpenSearch Architecture for Scaling
Before diving into tuning, it's crucial to grasp OpenSearch's distributed architecture. A typical OpenSearch cluster comprises several node types, each playing a critical role in scalability and resilience:
- Master Nodes: Responsible for cluster management tasks like creating/deleting indices, tracking node status, and allocating shards. They do not store data or handle search/indexing requests directly but are vital for cluster stability.
- Data Nodes: Store the actual indexed data in shards and handle data-related operations: indexing, searching, and aggregations. Most of your cluster's resources (CPU, RAM, disk I/O) will be consumed by data nodes.
- Ingest Nodes: Can pre-process documents before indexing, applying transformations like parsing, enrichment, or filtering. Useful for offloading processing from application logic.
- Coordinating-Only Nodes: Can route requests to the appropriate shards and gather results, acting as a load balancer and reducing the burden on data nodes, especially for complex queries. Not strictly necessary for small clusters but beneficial for large ones.
Shards: OpenSearch distributes an index's data across multiple shards. Each shard is a self-contained Lucene index. An index is composed of primary shards and replica shards.
- Primary Shards: Hold the primary copy of a portion of your data. The number of primary shards determines the maximum parallelism for indexing and search operations.
- Replica Shards: Are exact copies of primary shards, providing fault tolerance (if a node fails, a replica can become primary) and increasing read throughput (search requests can be served by any replica).
Relevance to Java Applications: When your Java application sends an indexing or search request, it typically hits a coordinating node (or a data node acting as one). This node then dispatches the request to the relevant primary or replica shards, gathers the results, and returns them to your application. Understanding this flow helps in diagnosing bottlenecks and optimizing client interactions.
2. Effective Index Naming Strategies
Proper index naming is the foundation of efficient index management. It enables clear organization, simplifies automation, and facilitates data lifecycle management.
Time-Based Indices
For time-series data like logs, metrics, or events, time-based indices are indispensable. They allow you to define retention policies easily and manage data growth.
- Daily:
logs-application-2023-10-26 - Weekly:
metrics-service-2023-W43 - Monthly:
events-user-2023-10
Application-Specific Indices
For transactional data that isn't primarily time-series, use descriptive names that reflect the data's domain.
ecommerce-productscustomer-profilesorder-transactions
Aliases for Abstraction
Aliases are powerful tools for abstracting your application from the physical index names. They allow you to point to one or more indices, making operations like reindexing or switching to new indices seamless without downtime or application code changes.
For example, your Java application can always query my-app-data while the alias actually points to my-app-data-v1 or my-app-data-2023-10.
{
  "actions": [
    { "remove": { "index": "my-app-data-old", "alias": "my-app-data" } },
    { "add": { "index": "my-app-data-new", "alias": "my-app-data" } }
  ]
}
Java Application Impact: Your Java code interacts with my-app-data, oblivious to the underlying index changes. This is crucial for blue/green deployments or schema migrations.
3. Index Lifecycle Management (ILM) for Data Retention
ILM automates the process of managing indices through various stages of their life cycle, from creation to deletion. This is vital for managing storage costs, maintaining performance, and ensuring compliance.
Common ILM phases:
- Hot: New data is actively being written and queried. Typically stored on high-performance storage (SSDs).
- Warm: Indexing has stopped, but data is still frequently queried. Can be moved to slower, cheaper storage.
- Cold: Data is rarely accessed but must be retained. Often moved to very cheap, object storage (e.g., S3).
- Delete: Data is no longer needed and can be safely removed.
Creating an ILM Policy
Policies define the actions an index takes as it ages. Here's an example policy for daily logs:
PUT /_ilm/policy/daily_logs_policy
{
  "policy": {
    "phases": {
      "hot": {
        "min_age": "0s",
        "actions": {
          "rollover": {
            "max_primary_shard_size": "50gb",
            "max_age": "1d"
          },
          "set_priority": {
            "priority": 100
          }
        }
      },
      "warm": {
        "min_age": "7d",
        "actions": {
          "forcemerge": {
            "max_num_segments": 1
          },
          "shrink": {
            "number_of_shards": 1
          },
          "set_priority": {
            "priority": 50
          }
        }
      },
      "cold": {
        "min_age": "30d",
        "actions": {
          "freeze": {},
          "set_priority": {
            "priority": 0
          }
        }
      },
      "delete": {
        "min_age": "90d",
        "actions": {
          "delete": {}
        }
      }
    }
  }
}
This policy rolls over daily or when a shard reaches 50GB, moves to warm after 7 days (forcemerges and shrinks shards), to cold after 30 days (freezes the index to reduce memory footprint), and deletes after 90 days.
Applying ILM to Indices
You apply an ILM policy by associating it with an index template. When new indices are created matching the template pattern, they inherit the policy.
PUT /_index_template/daily_logs_template
{
  "index_patterns": ["logs-application-*"],
  "template": {
    "settings": {
      "index.lifecycle.name": "daily_logs_policy",
      "index.lifecycle.rollover_alias": "logs-application"
    }
  },
  "composed_of": [],
  "priority": 500
}
Your Java application would then simply index into the alias logs-application, and OpenSearch, guided by ILM, will automatically manage the underlying indices.
4. Shard Sizing and Distribution Optimization
Shard count is one of the most critical tuning parameters. Incorrect sizing can lead to significant performance issues.
The "Too Many Shards" Problem
- Heap Overhead: Each shard consumes a certain amount of heap memory on the node it resides on. Too many small shards can lead to excessive heap usage, even if the total data size is small, causing frequent garbage collections and performance degradation.
- Increased Metadata: The master node must manage metadata for every shard, leading to higher CPU and memory usage for cluster state management.
- Slower Recoveries: Rebalancing or recovering a cluster with many small shards takes longer.
The "Too Few Shards" Problem
- Limited Parallelism: Search and indexing operations can only parallelize across primary shards. If you have too few, you can't fully utilize your cluster's resources.
- Hot Spots: A single large shard might reside on one node, becoming a bottleneck if that node is under heavy load.
- Scaling Limitations: You cannot add more nodes to distribute the load if all data is concentrated in a few large shards.
Optimal Shard Size
A good rule of thumb is to aim for shard sizes between 20GB and 50GB. This range provides a balance between manageability and parallelism. For very high-throughput indexing, you might go up to 100GB per shard, but monitor closely.
Number of Primary Shards
Consider your data volume, expected growth, and query patterns. Start with a reasonable number, then monitor and adjust. For example, if you expect 500GB of data and aim for 50GB shards, you'd need 500GB / 50GB = 10 primary shards.
Replica Shards
Typically, 1 or 2 replica shards are sufficient for high availability and read scalability. For critical indices, number_of_replicas: 2 is a common choice, meaning you have three copies of each shard (one primary, two replicas).
PUT /my-application-index
{
  "settings": {
    "index": {
      "number_of_shards": 5,
      "number_of_replicas": 1
    }
  }
}
Java Application Impact: The number of shards directly impacts how many concurrent search operations can effectively run. More shards can mean more parallelism, but only if they are appropriately sized and distributed across enough data nodes.
5. Mapping and Data Type Optimization
Efficient mappings are crucial for storing data compactly and enabling fast, relevant searches. Poor mapping choices can lead to bloated indices and slow queries.
keywordvs.text:- Use
keywordfor exact matches, sorting, and aggregations (e.g., product IDs, status codes, user names). It stores the value as a single token. - Use
textfor full-text search where you want to analyze the content (e.g., product descriptions, blog post bodies). It breaks down the value into tokens.
- Use
- Numeric Types: Use the smallest appropriate numeric type (
byte,short,integer,long,float,double).longis often a safe default for IDs or timestamps. _sourcefield: The_sourcefield stores the original JSON document. If you only need specific fields for retrieval and not the entire document, you can disable_sourceor use_source_includesand_source_excludesto store only necessary parts. This saves disk space and network bandwidth.dynamicmapping: By default, OpenSearch dynamically adds new fields to your mapping. For production systems, it's often better to set"dynamic": "strict"to prevent accidental field creation and ensure schema consistency. Unknown fields will cause documents to be rejected.index_options: Controls what information is stored in the inverted index fortextfields.docs(default) is sufficient for relevance scoring;freqs,positions,offsetsstore more info but increase index size.doc_values: Enabled by default for most fields,doc_valuesstore field values in a column-oriented fashion, making aggregations and sorting much faster. Only disable if you're certain a field will never be used for sorting or aggregations to save disk space.
Example Mapping
PUT /products
{
  "settings": {
    "index": {
      "number_of_shards": 3,
      "number_of_replicas": 1
    }
  },
  "mappings": {
    "dynamic": "strict",
    "properties": {
      "productId": {
        "type": "keyword"
      },
      "productName": {
        "type": "text",
        "fields": {
          "keyword": {
            "type": "keyword",
            "ignore_above": 256
          }
        }
      },
      "description": {
        "type": "text"
      },
      "price": {
        "type": "float"
      },
      "category": {
        "type": "keyword"
      },
      "stockQuantity": {
        "type": "integer"
      },
      "createdAt": {
        "type": "date"
      }
    }
  }
}
Java Application Impact: A well-defined mapping ensures that your application's data is stored and retrieved optimally. Mismatched data types (e.g., trying to sort on a text field) can lead to errors or extremely poor performance.
6. Bulk Operations from Java Applications
Indexing individual documents one by one is highly inefficient for high-throughput scenarios. OpenSearch's _bulk API allows you to send multiple indexing, update, or delete operations in a single request, drastically reducing network overhead and improving indexing performance.
Using OpenSearch Java Client for Bulk Operations
The OpenSearch Java client provides a BulkRequest API that simplifies batching.
import org.opensearch.client.opensearch.OpenSearchClient;
import org.opensearch.client.opensearch.core.BulkRequest;
import org.opensearch.client.opensearch.core.BulkResponse;
import org.opensearch.client.opensearch.core.bulk.BulkOperation;
import org.opensearch.client.opensearch.core.bulk.IndexOperation;
import org.springframework.stereotype.Service;

import java.io.IOException;
import java.util.ArrayList;
import java.util.List;

@Service
public class ProductIndexingService {

    private final OpenSearchClient openSearchClient;

    public ProductIndexingService(OpenSearchClient openSearchClient) {
        this.openSearchClient = openSearchClient;
    }

    public void indexProductsBulk(List<Product> products) throws IOException {
        BulkRequest.Builder br = new BulkRequest.Builder();

        for (Product product : products) {
            br.operations(op -> op
                .index(idx -> idx
                    .index("products")
                    .id(product.getId())
                    .document(product)
                )
            );
        }

        BulkResponse result = openSearchClient.bulk(br.build());

        if (result.errors()) {
            System.err.println("Bulk had errors");
            for (org.opensearch.client.opensearch.core.bulk.BulkResponseItem item : result.items()) {
                if (item.error() != null) {
                    System.err.println(item.error().reason());
                }
            }
        } else {
            System.out.println("Bulk indexing successful for " + products.size() + " products.");
        }
    }

    // Example Product class (simplified)
    public static class Product {
        private String id;
        private String name;
        private double price;

        public Product(String id, String name, double price) {
            this.id = id;
            this.name = name;
            this.price = price;
        }

        public String getId() { return id; }
        public void setId(String id) { this.id = id; }
        public String getName() { return name; }
        public void setName(String name) { this.name = name; }
        public double getPrice() { return price; }
        public void setPrice(double price) { this.price = price; }
    }

    // Example usage (e.g., in a main method or controller)
    public static void main(String[] args) throws IOException {
        // Assume openSearchClient is initialized
        // OpenSearchClient client = ...;
        // ProductIndexingService service = new ProductIndexingService(client);

        // List<Product> productsToIndex = new ArrayList<>();
        // productsToIndex.add(new Product("P001", "Laptop", 1200.00));
        // productsToIndex.add(new Product("P002", "Mouse", 25.00));
        // service.indexProductsBulk(productsToIndex);
    }
}
Best Practices for Bulk Operations:
- Batch Size: Experiment to find the optimal batch size. Too small, you lose efficiency; too large, you risk memory issues or timeouts. A common starting point is 1,000 to 5,000 documents, or a total payload size of 5-10MB.
- Error Handling: Always check
BulkResponse.errors()and iterate throughBulkResponseItemto identify individual failures. This allows you to retry failed operations selectively. - Asynchronous Processing: For very high ingestion rates, consider using
BulkProcessor(available in older clients) or implementing your own asynchronous bulk processing logic (e.g., usingCompletableFutureor message queues) to avoid blocking your application threads.
7. Refresh Interval and Translog Durability
These settings control the trade-off between indexing performance and search visibility/data durability.
index.refresh_interval
This setting determines how often OpenSearch refreshes an index, making newly indexed documents visible for search. The default is 1s.
- Shorter interval (e.g.,
1s): Near real-time search, but higher resource consumption due to frequent refreshes (which are I/O intensive). - Longer interval (e.g.,
30s,60s): Better indexing throughput, lower resource usage, but a delay before new documents appear in search results. - Disabling (
-1): Only refresh manually. Useful for initial bulk loads.
Tuning: For high-volume logging or metrics, you might increase this to 5s, 10s, or even 30s. For transactional data where immediate searchability is paramount, keep it at 1s or 2s.
PUT /my-high-throughput-index/_settings
{
  "index": {
    "refresh_interval": "30s"
  }
}
index.translog.durability
The translog is a write-ahead log that records all indexing operations before they are committed to Lucene. It ensures data durability in case of a crash.
request(default): The translog isfsynced(flushed to disk) on every index, update, or delete request. Provides maximum durability but can impact indexing performance.async: The translog isfsyncedasynchronously, typically every5sor after a certain number of operations (index.translog.sync_interval). Offers higher indexing throughput at the cost of potential data loss (up tosync_interval) in a crash.
Tuning: For critical data where no data loss is acceptable, stick with request. For high-throughput, less critical data (e.g., ephemeral logs), async can significantly boost indexing speed.
PUT /my-logs-index/_settings
{
  "index": {
    "translog.durability": "async",
    "translog.sync_interval": "5s"
  }
}
Java Application Impact: These settings directly influence the latency your application experiences during indexing and how quickly data becomes available for search. Choose settings that align with your application's specific requirements for data freshness and durability.
8. Heap Memory and JVM Tuning
OpenSearch runs on the JVM, making Java Virtual Machine (JVM) heap memory a critical resource. Incorrect JVM settings are a common cause of instability and poor performance.
JVM_HEAP_SIZE
- Rule of Thumb: Allocate approximately 50% of the node's available RAM to the JVM heap. This leaves enough memory for the operating system's file system cache, which Lucene (OpenSearch's core library) heavily relies on for performance.
- Hard Cap: Never allocate more than 30.5GB. Beyond this, the JVM cannot use compressed ordinary object pointers (OOPs), leading to larger object sizes and less efficient memory usage.
You set this via the OPENSEARCH_JAVA_OPTS environment variable or in jvm.options:
# In opensearch.yml or environment variable
OPENSEARCH_JAVA_OPTS="-Xms16g -Xmx16g"
Garbage Collector
OpenSearch typically uses the G1 Garbage Collector (-XX:+UseG1GC) by default, which is generally well-suited for large heaps and multi-core systems. Ensure it's enabled and monitor its behavior (pause times, frequency) to identify potential issues.
Monitoring Heap Usage
Use OpenSearch Dashboards (Stack Monitoring) or external tools like Prometheus/Grafana to monitor heap usage. Consistently high heap usage or frequent, long garbage collection pauses indicate a need for more RAM, better shard sizing, or query optimization.
Java Application Impact: While this is server-side tuning, a healthy OpenSearch JVM directly translates to faster response times for your Java application's search and indexing requests. Poor JVM performance on the cluster will manifest as slow API calls in your application.
9. Thread Pools and Queue Sizes
OpenSearch uses various thread pools to manage different types of operations (search, indexing, bulk). Tuning these can prevent resource starvation and request rejections under heavy load.
searchthread pool: Handles search requests. If the queue is full, search requests will be rejected.writethread pool: Handles single-document indexing requests. (Note: Bulk requests use thebulkthread pool).bulkthread pool: Handles bulk indexing requests. This is often the most critical for high-throughput Java applications.
Tuning Example (via opensearch.yml or Cluster Settings)
# opensearch.yml or via PUT /_cluster/settings
thread_pool.bulk.size: 8       # Number of threads
thread_pool.bulk.queue_size: 1000 # Max requests in queue before rejection
Considerations:
size: Often tied to the number of CPU cores. A common starting point isnumber_of_cores * 1.5for I/O-bound tasks. Don't set it too high, as context switching overhead will negate benefits.queue_size: Increase this if you see frequent rejections (EsRejectedExecutionExceptionin your Java application logs). A larger queue can buffer bursts of requests but also means higher latency if the queue is consistently full.- Monitoring: Monitor
thread_pool.bulk.queueandthread_pool.bulk.rejectedmetrics. High rejections indicate that your cluster can't keep up with the incoming load, requiring either more resources, better tuning, or backpressure in your Java application.
Java Application Impact: Configuring thread pools correctly helps OpenSearch absorb bursts of requests from your Java application without immediately rejecting them. If requests are rejected, your Java application needs robust retry mechanisms.
10. Cluster Monitoring and Alerting
Effective monitoring is non-negotiable for a scalable OpenSearch cluster. It provides insights into performance, resource utilization, and potential issues.
Key Metrics to Monitor:
- Node Level:
- CPU Usage: High CPU often points to complex queries, heavy indexing, or insufficient resources.
- Memory Usage (Heap & Non-Heap): Track JVM heap usage, garbage collection activity, and overall system memory.
- Disk I/O: Critical for data nodes. High I/O wait can indicate slow disks or heavy indexing/searching.
- Disk Space: Prevent nodes from running out of disk space, which can lead to shard allocation failures.
- Network I/O: Monitor inter-node communication and client traffic.
- Cluster Level:
- Cluster Health:
green(all primary and replica shards available),yellow(all primary shards available, but some replicas missing),red(some primary shards missing). - Shard Allocation: Ensure shards are evenly distributed and no unassigned shards exist.
- Indexing Rate: Documents indexed per second.
- Search Latency: Average time for search requests.
- Rejected Tasks: From thread pools (e.g.,
bulk,search).
- Cluster Health:
- JVM Metrics: GC pause times, heap usage.
Tools for Monitoring:
- OpenSearch Dashboards: Provides built-in monitoring (Stack Monitoring) with visualizations for cluster health, node metrics, indexing/search performance, and more.
- Prometheus & Grafana: A popular combination for collecting and visualizing OpenSearch metrics. OpenSearch exposes metrics via a
/_cat/nodes?h=name,heap.percent,cpu,load_1m,load_5m,load_15m,disk.used_percent,bulk.queue_size,bulk.rejectedendpoint or more detailed JMX exporters. - Cloud Provider Monitoring: If using AWS OpenSearch Service, leverage CloudWatch metrics and alarms.
Alerting
Configure alerts for critical thresholds:
- Red Cluster Health: Immediate high-priority alert.
- High CPU/Memory Usage: For data nodes (e.g., >80% for 5 minutes).
- Low Disk Space: (e.g., <20% free).
- Rejected Requests: Sustained high rate of rejected bulk/search requests.
- Long GC Pauses: Indicating JVM pressure.
Java Application Impact: Monitoring allows you to proactively identify and address OpenSearch performance issues before they impact your Java application's users. Integrating OpenSearch metrics into your application's observability platform (e.g., using Micrometer) provides a unified view.
11. Best Practices for OpenSearch and Java Integration
Optimizing your Java application's interaction with OpenSearch is as important as tuning the cluster itself.
-
Use the Official OpenSearch Java Client: Always use the latest compatible version of the official OpenSearch Java client library. It provides a robust, high-performance, and type-safe way to interact with your cluster.
java// Example Spring Boot configuration for OpenSearchClient import org.apache.http.HttpHost; import org.opensearch.client.opensearch.OpenSearchClient; import org.opensearch.client.opensearch._types.OpenSearchException; import org.opensearch.client.transport.OpenSearchTransport; import org.opensearch.client.transport.restclient.RestClientTransport; import org.springframework.context.annotation.Bean; import org.springframework.context.annotation.Configuration; import org.opensearch.client.RestClient; @Configuration public class OpenSearchConfig { @Bean public OpenSearchClient openSearchClient() { // Configure the RestClient RestClient restClient = RestClient.builder( new HttpHost("localhost", 9200, "http")) // Add more hosts if you have a cluster // .setHttpClientConfigCallback(httpClientBuilder -> { // // Configure authentication, SSL, etc. // return httpClientBuilder; // }) .build(); // Create the transport with the RestClient OpenSearchTransport transport = new RestClientTransport( restClient, new org.opensearch.client.json.jackson.JacksonJsonpMapper()); // Create the API client return new OpenSearchClient(transport); } } -
Connection Pooling: The
RestClientused by the Java client inherently manages connection pooling. Ensure you configure it appropriately for your workload (e.g.,setMaxConnTotal,setMaxConnPerRoute). Spring Boot's auto-configuration often handles this reasonably well. -
Asynchronous Client Usage: For applications requiring high concurrency and low latency, consider using the asynchronous client provided by the OpenSearch Java client. This allows your application threads to perform other tasks while waiting for OpenSearch responses.
-
Retry Mechanisms: Implement robust retry logic with exponential backoff for transient OpenSearch errors (e.g., connection issues,
EsRejectedExecutionException). Resilience4j is an excellent library for this in Java. -
Circuit Breakers: Employ circuit breakers (e.g., Hystrix, Resilience4j) to prevent your application from overwhelming a struggling OpenSearch cluster and to gracefully degrade functionality.
-
Query Optimization: Design efficient queries. Use
_source_includesto fetch only necessary fields. Avoid*in queries. Useboolqueries effectively. Prefertermovermatchfor exact matches. -
Scroll API for Deep Pagination: For fetching large result sets, avoid
from/sizepagination beyond 10,000 results. Use the Scroll API orsearch_afterfor efficient deep pagination. -
Version Compatibility: Always ensure your OpenSearch Java client version is compatible with your OpenSearch cluster version.
12. Common Pitfalls and How to Avoid Them
Even with the best intentions, developers and operators can fall into common traps when scaling OpenSearch.
- Too Many Small Shards: As discussed, this leads to excessive heap usage, slow recoveries, and metadata overhead. Avoid: Aim for 20-50GB per shard. Use ILM with rollover based on size or age.
- Not Using ILM: Manually managing indices is tedious, error-prone, and leads to uncontrolled data growth and high storage costs. Avoid: Implement ILM from day one for all time-series data.
- Indexing Without Bulk Operations: Single-document indexing for high-volume data is a performance killer. Avoid: Always use the
_bulkAPI with appropriate batching for mass indexing. - Ignoring Monitoring Alerts: Alerts are only useful if acted upon. Ignoring
redcluster health, high CPU, or disk space warnings guarantees future outages. Avoid: Establish clear alerting policies and response procedures. - Under-provisioning Hardware: Trying to save costs by running OpenSearch on insufficient hardware will inevitably lead to performance issues and instability. Avoid: Start with adequate resources, monitor, and scale horizontally by adding more data nodes as needed.
- Not Using Aliases: Directly referencing physical index names in your application makes schema changes, reindexing, and ILM rollovers complex and potentially downtime-inducing. Avoid: Use aliases for all application interactions with indices.
- Over-Reliance on
_allField (if enabled): If your mapping still uses_all(deprecated in newer versions), it can lead to bloated indices. Avoid: Define explicit mappings and search specific fields. - Not Setting
refresh_intervalAppropriately: For logging or metrics, a 1s refresh interval can be overkill and resource-intensive. Avoid: Increaserefresh_intervalfor non-real-time data.
Conclusion
Scaling OpenSearch for Java applications is a continuous journey that requires a deep understanding of both your application's data patterns and OpenSearch's intricate architecture. By meticulously managing your indices through strategies like effective naming and ILM, and by carefully tuning your cluster's JVM, thread pools, and shard distribution, you can build a highly performant, resilient, and cost-efficient search and analytics platform.
Remember that tuning is not a one-time task. Continuously monitor your cluster's performance, analyze your application's access patterns, and iterate on your configurations. Embrace automation, leverage the OpenSearch Java client's full capabilities, and proactively address pitfalls to ensure your OpenSearch cluster remains a robust asset for your growing Java applications. With these strategies, you're well-equipped to tackle the challenges of data at scale.
Written by
CodewithYohaFull-Stack Software Engineer with 7+ years of experience in Java, Spring Boot, and cloud architecture across AWS, Azure, and GCP. Writing production-grade engineering patterns for developers who ship real software.