Introduction
The shift from monolithic architectures to microservices has brought immense benefits in terms of scalability, resilience, and development agility. However, this architectural evolution introduces a significant challenge: understanding the flow of requests across dozens, hundreds, or even thousands of interconnected services. When a user experiences a slow response or an error, pinpointing the exact service responsible in a distributed system can feel like searching for a needle in a haystack.
Enter Distributed Tracing. It's the critical observability pillar that allows you to visualize the end-to-end journey of a request as it traverses multiple services. While many proprietary tracing solutions exist, the industry has rallied around a unified, vendor-neutral standard: OpenTelemetry.
OpenTelemetry (often abbreviated as OTel) is a Cloud Native Computing Foundation (CNCF) project that provides a set of APIs, SDKs, and tools to instrument, generate, collect, and export telemetry data (traces, metrics, and logs) from your applications. It aims to standardize how you collect observability data, freeing you from vendor lock-in and allowing you to choose the best backend for your needs.
This comprehensive guide will dive deep into using OpenTelemetry for end-to-end distributed tracing in microservices. We'll cover its architecture, practical instrumentation with code examples, best practices, and common pitfalls, equipping you to gain unparalleled visibility into your distributed systems.
Prerequisites
To get the most out of this guide, you should have:
- A basic understanding of microservices architecture.
- Familiarity with at least one programming language (e.g., Python, Go).
- Docker and Docker Compose installed for setting up the tracing backend.
- A text editor or IDE.
The Challenge of Microservices Observability
In a monolithic application, debugging a problem is often straightforward. You can typically inspect logs, stack traces, and performance metrics within a single process. However, microservices break down this simplicity:
- Inter-service Communication: Requests travel across network boundaries, often involving HTTP/gRPC calls, message queues, and databases.
- Asynchronous Processing: Many operations are handled asynchronously, making it difficult to link related events.
- Polyglot Environments: Different services might be written in different languages, using various frameworks.
- Dynamic Scaling: Services scale up and down independently, making it harder to track specific instances.
Without proper tools, understanding how a user request flows through this complex web of services, identifying bottlenecks, or diagnosing errors becomes an arduous, time-consuming task. This is where distributed tracing shines.
What is Distributed Tracing?
Distributed tracing is a method of monitoring and profiling requests as they propagate through a distributed system. It provides a full contextual view of how a request is processed from its origin to its completion, spanning multiple services and processes.
Key concepts in distributed tracing:
- Trace: Represents a single end-to-end operation or request within a distributed system. It's a collection of spans, causally related, representing the entire journey of a request.
- Span: The basic unit of a trace. A span represents a single operation within a trace, such as an HTTP request, a database query, or a function call. Spans have a name, a start time, an end time, attributes (key-value pairs describing the operation), and can have child spans.
- Parent-Child Relationship: Spans are organized hierarchically. A parent span might represent a service's processing of a request, while child spans represent internal operations or calls to other services.
- Context Propagation: The mechanism by which trace and span IDs (the "context") are passed between services. This is crucial for linking spans together to form a complete trace, typically done via HTTP headers (e.g.,
traceparent,tracestate).
Introducing OpenTelemetry
OpenTelemetry emerged from the merger of OpenTracing and OpenCensus, combining the best aspects of both projects to create a single, comprehensive standard for observability. Its primary goals are to:
- Standardize Telemetry Data: Provide a common format and protocol for collecting traces, metrics, and logs.
- Vendor Neutrality: Allow users to instrument their applications once and export data to any compatible backend, avoiding vendor lock-in.
- Ease of Use: Offer intuitive APIs and SDKs across multiple languages.
Key Components of OpenTelemetry:
- API (Application Programming Interface): Defines how to create telemetry data (e.g.,
Tracerfor traces,Meterfor metrics). These are language-specific interfaces. - SDK (Software Development Kit): An implementation of the API that processes and exports telemetry data. It includes components like
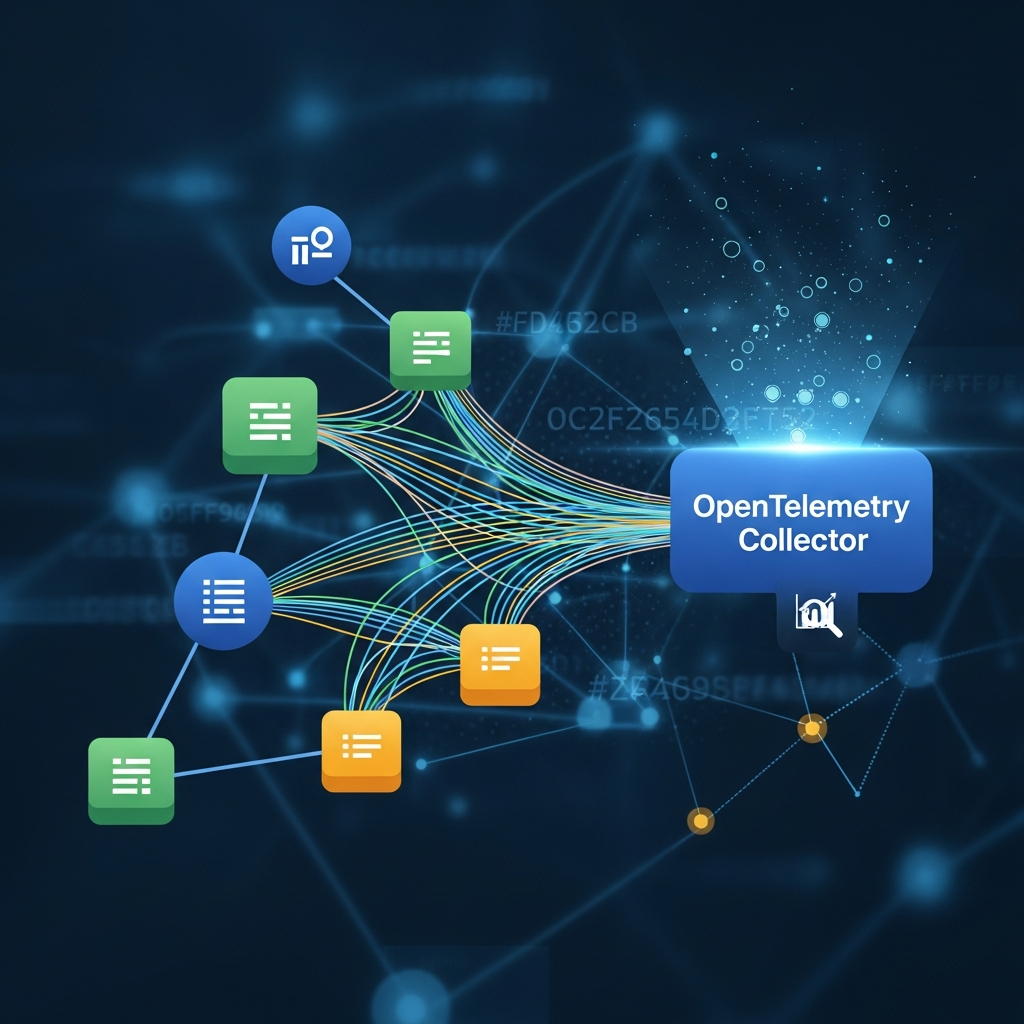
SpanProcessorsandExporters. - Collector: An agent that can receive, process, and export telemetry data. It's a vendor-agnostic proxy that sits between your application and the observability backend. It can run as an agent sidecar, a daemonset, or a standalone service.
- Exporters: Components within the SDK or Collector that send telemetry data to various backends (e.g., Jaeger, Prometheus, Zipkin, proprietary APM solutions).
OpenTelemetry Architecture Overview
Understanding the flow of telemetry data is crucial. Here's a typical architecture:
- Applications: Your microservices are instrumented with the OpenTelemetry SDKs.
- OTel SDK: In each application, the SDK captures telemetry data (spans, metrics) according to the API definitions. It then batches and processes this data.
- OpenTelemetry Collector: The SDK exports the processed data (typically via OTLP - OpenTelemetry Protocol) to the Collector. The Collector can then perform various operations:
- Receivers: Ingest data in various formats (OTLP, Jaeger, Zipkin, Prometheus).
- Processors: Batch data, add resource attributes, filter, sample, rename spans, apply transformations.
- Exporters: Send the processed data to one or more observability backends.
- Observability Backend: A system like Jaeger (for traces), Prometheus (for metrics), or a commercial APM solution, which stores, visualizes, and analyzes the telemetry data.
This decoupling via the Collector is powerful, allowing you to centralize telemetry processing and easily switch backends without re-instrumenting your applications.
Getting Started: Setting up a Basic Tracing Environment
Let's set up a minimal environment using Docker Compose that includes an OpenTelemetry Collector and Jaeger as our tracing backend.
Create a docker-compose.yml file:
version: '3.8'
services:
  jaeger:
    image: jaegertracing/all-in-one:latest
    ports:
      - "16686:16686" # Jaeger UI
      - "14268:14268" # Jaeger gRPC collector
      - "14250:14250" # Jaeger Thrift collector
      - "6831:6831/udp" # Jaeger agent (for UDP traces)
    environment:
      COLLECTOR_OTLP_ENABLED: true # Enable OTLP receiver for Jaeger

  otel-collector:
    image: otel/opentelemetry-collector-contrib:latest
    command: [--config=/etc/otel-collector-config.yml]
    volumes:
      - ./otel-collector-config.yml:/etc/otel-collector-config.yml
    ports:
      - "4317:4317" # OTLP gRPC receiver
      - "4318:4318" # OTLP HTTP receiver
      - "8889:8889" # Prometheus metrics exporter
    depends_on:
      - jaeger
Next, create otel-collector-config.yml in the same directory:
receivers:
  otlp:
    protocols:
      grpc:
      http:

processors:
  batch:
    send_batch_size: 100
    timeout: 10s
  resourcedetection:
    detectors: [env, system]
    override: true

exporters:
  jaeger:
    grpc:
      endpoint: jaeger:14250 # Jaeger's gRPC collector endpoint
  logging: # For debugging, prints traces to collector logs
    loglevel: debug

service:
  pipelines:
    traces:
      receivers: [otlp]
      processors: [resourcedetection, batch]
      exporters: [jaeger, logging]
Now, run docker-compose up -d. You should be able to access the Jaeger UI at http://localhost:16686.
Instrumenting Your Microservices with OpenTelemetry (Code Examples)
Instrumentation is the process of adding code to your application to generate telemetry data. OpenTelemetry provides both automatic and manual instrumentation options.
Python Example: Flask Microservice
Let's create two Flask services: service-a and service-b. service-a will call service-b.
First, install the necessary OpenTelemetry packages:
pip install Flask opentelemetry-api opentelemetry-sdk opentelemetry-exporter-otlp-grpc opentelemetry-instrumentation-flask opentelemetry-instrumentation-requestsservice-b.py (The downstream service)
import os
from flask import Flask, request
from opentelemetry import trace
from opentelemetry.sdk.resources import Resource
from opentelemetry.sdk.trace import TracerProvider
from opentelemetry.sdk.trace.export import BatchSpanProcessor
from opentelemetry.exporter.otlp.proto.grpc.trace_exporter import OTLPSpanExporter
from opentelemetry.instrumentation.flask import FlaskInstrumentor

# Configure OpenTelemetry to export to the collector
resource = Resource.create({"service.name": "service-b"})
provider = TracerProvider(resource=resource)
otlp_exporter = OTLPSpanExporter(endpoint="otel-collector:4317", insecure=True)
provider.add_span_processor(BatchSpanProcessor(otlp_exporter))
trace.set_tracer_provider(provider)

app = Flask(__name__)
FlaskInstrumentor().instrument_app(app) # Auto-instrument Flask

tracer = trace.get_tracer(__name__)

@app.route("/hello")
def hello_world():
    # Manual span to demonstrate custom logic tracing
    with tracer.start_as_current_span("process_hello_request") as span:
        span.set_attribute("http.method", request.method)
        span.set_attribute("user.agent", request.headers.get("User-Agent"))
        # Simulate some work
        import time
        time.sleep(0.05)
        span.add_event("simulated_work_done", {"duration_ms": 50})
    return "Hello from Service B!\n"

if __name__ == "__main__":
    app.run(host="0.0.0.0", port=5001)
service-a.py (The upstream service)
import os
import requests
from flask import Flask, request
from opentelemetry import trace
from opentelemetry.sdk.resources import Resource
from opentelemetry.sdk.trace import TracerProvider
from opentelemetry.sdk.trace.export import BatchSpanProcessor
from opentelemetry.exporter.otlp.proto.grpc.trace_exporter import OTLPSpanExporter
from opentelemetry.instrumentation.flask import FlaskInstrumentor
from opentelemetry.instrumentation.requests import RequestsInstrumentor

# Configure OpenTelemetry to export to the collector
resource = Resource.create({"service.name": "service-a"})
provider = TracerProvider(resource=resource)
otlp_exporter = OTLPSpanExporter(endpoint="otel-collector:4317", insecure=True)
provider.add_span_processor(BatchSpanProcessor(otlp_exporter))
trace.set_tracer_provider(provider)

app = Flask(__name__)
FlaskInstrumentor().instrument_app(app) # Auto-instrument Flask
RequestsInstrumentor().instrument()     # Auto-instrument 'requests' library

tracer = trace.get_tracer(__name__)

@app.route("/call-b")
def call_service_b():
    # The 'requests' library will automatically propagate context due to instrumentation
    response = requests.get("http://service-b:5001/hello")
    return f"Response from Service B: {response.text}"

if __name__ == "__main__":
    app.run(host="0.0.0.0", port=5000)
To run these, you'd typically containerize them. Here's a Dockerfile for each (assuming Python 3.9):
# Dockerfile for service-a and service-b
FROM python:3.9-slim-buster
WORKDIR /app
COPY requirements.txt .
RUN pip install -r requirements.txt
COPY . .
EXPOSE 5000 # or 5001 for service-b
CMD ["python", "service-a.py"] # or service-b.py
Add these to your docker-compose.yml:
# ... (existing services)

  service-a:
    build: .
    ports:
      - "5000:5000"
    environment:
      OTEL_EXPORTER_OTLP_ENDPOINT: http://otel-collector:4317 # Ensure collector endpoint is correct
      OTEL_SERVICE_NAME: service-a
    depends_on:
      - otel-collector

  service-b:
    build: .
    ports:
      - "5001:5001"
    environment:
      OTEL_EXPORTER_OTLP_ENDPOINT: http://otel-collector:4317
      OTEL_SERVICE_NAME: service-b
    depends_on:
      - otel-collector
Build the images (docker-compose build) and then run (docker-compose up -d). Access http://localhost:5000/call-b and then check Jaeger UI at http://localhost:16686.
Go Example: HTTP Microservice
Let's create a similar setup in Go.
First, initialize a Go module and install dependencies:
mkdir go-services && cd go-services
go mod init go-services
go get go.opentelemetry.io/otel \
  go.opentelemetry.io/otel/sdk \
  go.opentelemetry.io/otel/exporters/otlp/otlptrace/otlptracegrpc \
  go.opentelemetry.io/otel/trace \
  go.opentelemetry.io/contrib/instrumentation/net/http/otelhttp \
  google.golang.org/grpc
service-b/main.go
package main

import (
	"context"
	"fmt"
	"log"
	"net/http"
	"time"

	otel "go.opentelemetry.io/otel"
	oteltrace "go.opentelemetry.io/otel/trace"
	otelhttp "go.opentelemetry.io/contrib/instrumentation/net/http/otelhttp"
	"go.opentelemetry.io/otel/exporters/otlp/otlptrace/otlptracegrpc"
	"go.opentelemetry.io/otel/sdk/resource"
	"go.opentelemetry.io/otel/sdk/trace"
	semconv "go.opentelemetry.io/otel/semconv/v1.17.0"
	"google.golang.org/grpc"
	"google.golang.org/grpc/credentials/insecure"
)

func initTracer() *trace.TracerProvider {
	// Create the OTLP exporter
	ctx := context.Background()
	conn, err := grpc.DialContext(ctx, "otel-collector:4317",
		grpc.WithTransportCredentials(insecure.NewCredentials()),
		grpc.WithBlock(),
	)
	if err != nil {
		log.Fatalf("failed to dial gRPC: %v", err)
	}

	otlpExporter, err := otlptracegrpc.New(ctx, otlptracegrpc.WithGRPCConn(conn))
	if err != nil {
		log.Fatalf("Failed to create OTLP trace exporter: %v", err)
	}

	// Create a new tracer provider with a batch span processor and the OTLP exporter
	tracerProvider := trace.NewTracerProvider(
		trace.WithBatcher(otlpExporter),
		trace.WithResource(resource.NewWithAttributes(
			semconv.SchemaURL,
			semconv.ServiceNameKey.String("service-b"),
		)),
	)

	otel.SetTracerProvider(tracerProvider)

	return tracerProvider
}

func helloHandler(w http.ResponseWriter, r *http.Request) {
	// Get the current span context from the request context
	ctx := r.Context()
	tracer := otel.Tracer("service-b-tracer")

	// Manually create a child span
	_, span := tracer.Start(ctx, "process_hello_request")
	defer span.End()

	span.SetAttributes(semconv.HTTPMethodKey.String(r.Method))
	span.AddEvent("simulated_work_start")
	time.Sleep(50 * time.Millisecond) // Simulate work
	span.AddEvent("simulated_work_end")

	fmt.Fprintf(w, "Hello from Service B!\n")
}

func main() {
	tracerProvider := initTracer()
	defer func() {
		if err := tracerProvider.Shutdown(context.Background()); err != nil {
			log.Printf("Error shutting down tracer provider: %v", err)
		}
	}()

	// Use otelhttp.NewHandler to automatically instrument incoming requests
	http.Handle("/hello", otelhttp.NewHandler(http.HandlerFunc(helloHandler), "hello-endpoint"))

	fmt.Println("Service B listening on :5001")
	log.Fatal(http.ListenAndServe(":5001", nil))
}
service-a/main.go
package main

import (
	"context"
	"fmt"
	"io"
	"log"
	"net/http"

	otel "go.opentelemetry.io/otel"
	otelhttp "go.opentelemetry.io/contrib/instrumentation/net/http/otelhttp"
	"go.opentelemetry.io/otel/exporters/otlp/otlptrace/otlptracegrpc"
	"go.opentelemetry.io/otel/sdk/resource"
	"go.opentelemetry.io/otel/sdk/trace"
	semconv "go.opentelemetry.io/otel/semconv/v1.17.0"
	"google.golang.org/grpc"
	"google.golang.org/grpc/credentials/insecure"
)

func initTracer() *trace.TracerProvider {
	ctx := context.Background()
	conn, err := grpc.DialContext(ctx, "otel-collector:4317",
		grpc.WithTransportCredentials(insecure.NewCredentials()),
		grpc.WithBlock(),
	)
	if err != nil {
		log.Fatalf("failed to dial gRPC: %v", err)
	}

	otlpExporter, err := otlptracegrpc.New(ctx, otlptracegrpc.WithGRPCConn(conn))
	if err != nil {
		log.Fatalf("Failed to create OTLP trace exporter: %v", err)
	}

	tracerProvider := trace.NewTracerProvider(
		trace.WithBatcher(otlpExporter),
		trace.WithResource(resource.NewWithAttributes(
			semconv.SchemaURL,
			semconv.ServiceNameKey.String("service-a"),
		)),
	)
	otel.SetTracerProvider(tracerProvider)

	return tracerProvider
}

func callBHandler(w http.ResponseWriter, r *http.Request) {
	ctx := r.Context()

	// Create an HTTP client that automatically propagates trace context
	client := http.Client{Transport: otelhttp.NewTransport(http.DefaultTransport)}

	req, err := http.NewRequestWithContext(ctx, "GET", "http://service-b:5001/hello", nil)
	if err != nil {
		http.Error(w, fmt.Sprintf("Failed to create request: %v", err), http.StatusInternalServerError)
		return
	}

	resp, err := client.Do(req)
	if err != nil {
		http.Error(w, fmt.Sprintf("Failed to call Service B: %v", err), http.StatusInternalServerError)
		return
	}
	defer resp.Body.Close()

	body, err := io.ReadAll(resp.Body)
	if err != nil {
		http.Error(w, fmt.Sprintf("Failed to read response body: %v", err), http.StatusInternalServerError)
		return
	}

	fmt.Fprintf(w, "Response from Service B: %s", string(body))
}

func main() {
	tracerProvider := initTracer()
	defer func() {
		if err := tracerProvider.Shutdown(context.Background()); err != nil {
			log.Printf("Error shutting down tracer provider: %v", err)
		}
	}()

	http.Handle("/call-b", otelhttp.NewHandler(http.HandlerFunc(callBHandler), "call-b-endpoint"))

	fmt.Println("Service A listening on :5000")
	log.Fatal(http.ListenAndServe(":5000", nil))
}
For docker-compose.yml, you'd add similar service definitions, using Go's official Docker images and building from the respective service-a and service-b directories.
OpenTelemetry Collector Configuration
The OpenTelemetry Collector is incredibly flexible. Let's break down the otel-collector-config.yml we used earlier:
receivers:
  otlp:
    protocols:
      grpc:
      http:

processors:
  batch:
    send_batch_size: 100
    timeout: 10s
  resourcedetection:
    detectors: [env, system]
    override: true

exporters:
  jaeger:
    grpc:
      endpoint: jaeger:14250
  logging:
    loglevel: debug

service:
  pipelines:
    traces:
      receivers: [otlp]
      processors: [resourcedetection, batch]
exporters: [jaeger, logging]receivers: Defines how the Collector accepts telemetry data. Here,otlpis configured to accept both gRPC (port 4317) and HTTP (port 4318) connections. Your applications send data to these endpoints.processors: Manipulate telemetry data between reception and export.batch: Batches spans/metrics to reduce network overhead and improve efficiency.send_batch_sizeandtimeoutcontrol when batches are sent.resourcedetection: Automatically adds resource attributes (e.g., host name, OS, Kubernetes pod info) to your telemetry data, enriching it with infrastructure context.envandsystemare common detectors.
exporters: Send processed data to one or more backends.jaeger: Exports traces to a Jaeger backend via gRPC.logging: A useful exporter for debugging, it prints received telemetry data to the Collector's logs.
service.pipelines: Defines the data flow. Each pipeline specifies whichreceivers,processors, andexportersto use for a particular telemetry signal (traces, metrics, logs).- The
tracespipeline takes OTLP-received traces, processes them withresourcedetectionandbatchprocessors, and then exports them to bothjaegerandlogging.
- The
This modular design allows you to create complex processing pipelines, such as filtering sensitive data, sampling, or routing data to different backends based on specific criteria.
Context Propagation in Depth
Context propagation is the glue that binds individual spans into a complete trace across service boundaries. When service-a calls service-b, service-a must inject its current trace context (trace ID, span ID of the parent span) into the outgoing request. service-b then extracts this context from the incoming request and uses it to create new spans that are children of service-a's span.
OpenTelemetry leverages the W3C Trace Context standard, which defines two HTTP headers:
traceparent: Contains the trace ID, parent span ID, and flags. Example:00-4bf92f3577b34da6a3ce929d0e0e4736-00f067aa0ba902b7-01tracestate: Provides additional vendor-specific trace information, if needed.
When you use OpenTelemetry's automatic instrumentations (like FlaskInstrumentor and RequestsInstrumentor in Python, or otelhttp in Go), they handle this injection and extraction automatically. For custom communication protocols (e.g., a proprietary message queue), you might need to manually extract the context from the message and inject it into the span creation, or vice-versa.
from opentelemetry import propagate
from opentelemetry.propagate import extract, inject
from opentelemetry.trace.propagation.tracecontext import TraceContextTextMapPropagator

# --- In a sending service ---
carrier = {}
# Inject current span context into the carrier (e.g., HTTP headers, message queue properties)
TraceContextTextMapPropagator().inject(carrier, context=trace.get_current_span().get_context())
# carrier now contains 'traceparent' and 'tracestate' headers
# Send carrier along with your request/message

# --- In a receiving service ---
# Assume 'received_carrier' contains the headers from the sender
ctx = TraceContextTextMapPropagator().extract(received_carrier)
# Start a new span using the extracted context as the parent
with tracer.start_as_current_span("my-operation", context=ctx):
    # ... process request ...
Best Practices for Distributed Tracing
- Consistent Service Naming: Use clear, consistent, and unique
service.nameattributes for all your services. This is fundamental for organizing traces in your backend. - Strategic Instrumentation:
- Automatic Instrumentation First: Leverage built-in instrumentations for popular frameworks (HTTP servers/clients, databases, message queues) whenever possible. They save time and reduce errors.
- Manual Instrumentation for Business Logic: Use manual spans to trace critical business transactions, complex algorithms, or specific function calls that are important for debugging or performance analysis. Don't overdo it; aim for high-value operations.
- Meaningful Span Naming: Give spans descriptive names that indicate the operation being performed (e.g.,
UserService.GetUserById,Database.QueryUsers,PaymentGateway.AuthorizeTransaction). Avoid generic names likefunction_call. - Enrich Spans with Attributes: Add relevant attributes (key-value pairs) to your spans to provide context.
- Standard Attributes: Use OpenTelemetry semantic conventions (e.g.,
http.method,db.statement,user.id). - Custom Attributes: Add business-specific attributes (e.g.,
order.id,customer.type,cart.item_count). Be mindful of cardinality.
- Standard Attributes: Use OpenTelemetry semantic conventions (e.g.,
- Error Handling: Record exceptions and errors as span events or attributes. Set the span status to
ERRORwhen an operation fails. This makes it easy to filter for problematic traces. - Sampling: In production, sending every single trace can be overwhelming and costly. Implement sampling strategies:
- Head-based Sampling: Decisions are made at the start of a trace. Useful for sampling a fixed percentage or always tracing certain types of requests (e.g., those with a specific header).
- Tail-based Sampling: Decisions are made after a trace is complete (typically in the Collector). This allows sampling based on criteria like errors or high latency. Requires more processing power in the Collector.
- Resource Attributes: Ensure your services are configured to include resource attributes (e.g., host ID, Kubernetes pod name, environment). The
resourcedetectionprocessor in the Collector helps with this. - Security and PII: Be extremely cautious about what data you include in span attributes or events. Avoid sending Personally Identifiable Information (PII) or sensitive data into your tracing system.
Common Pitfalls and Troubleshooting
- Missing Context Propagation: The most common issue. Traces break at service boundaries, resulting in multiple disjointed traces instead of a single end-to-end trace. Ensure all inter-service communication mechanisms (HTTP clients, gRPC clients, message queue producers) are correctly instrumented to inject/extract context.
- High Cardinality Attributes: Adding attributes with a very large number of unique values (e.g., full request URLs with unique IDs, timestamps) can overwhelm your tracing backend, leading to performance issues and high storage costs. Aggregate or redact such values.
- Over-sampling or Under-sampling:
- Too aggressive sampling: You miss critical traces, especially for rare errors or performance spikes.
- Too little sampling: You collect too much data, leading to high costs and reduced performance of your tracing backend.
- Find a balance, perhaps using different sampling rates for development vs. production environments.
- Collector Misconfiguration: Incorrect
endpointfor exporters, wrongprotocolsfor receivers, or missingpipelinescan prevent data from flowing to your backend. Check Collector logs for errors. - Performance Overhead: While OpenTelemetry is designed to be lightweight, excessive manual instrumentation or very high sampling rates can introduce overhead. Monitor your application's CPU and memory usage after instrumentation.
- Time Skew: If clocks between services are not synchronized, trace timelines can appear incorrect. Use NTP or similar services to synchronize server clocks.
Real-World Use Cases
Distributed tracing with OpenTelemetry empowers you to solve complex problems in microservices environments:
- Performance Bottleneck Identification: Easily spot which service or operation within a service is causing latency. If a trace shows a specific database call taking 80% of the total request time, you know where to focus your optimization efforts.
- Root Cause Analysis of Errors: When an error occurs, traces can quickly lead you to the exact service, function, or even line of code that failed, showing the full context of the request that led to the error.
- Understanding Service Dependencies: Visualize the call graph of your services for any given request. This helps in understanding complex interactions, identifying unexpected dependencies, and during refactoring or onboarding new team members.
- Optimizing User Journeys: Track critical user flows (e.g., checkout process, user registration) end-to-end to identify points of friction, drop-offs, or performance degradation that impact user experience.
- Capacity Planning: By understanding the performance characteristics of individual services under load, you can make more informed decisions about scaling and resource allocation.
- A/B Testing and Feature Flag Analysis: Correlate trace data with feature flags to understand the performance impact or error rate of new features in production.
Conclusion
OpenTelemetry is a game-changer for microservices observability. By providing a unified, vendor-neutral standard for collecting traces (and metrics and logs), it empowers developers and operations teams to gain deep insights into the behavior of their distributed systems.
Implementing end-to-end distributed tracing might seem daunting at first, but by following the principles and practices outlined in this guide – from setting up your collector to judiciously instrumenting your code and understanding context propagation – you can unlock unparalleled visibility.
Start small, instrument your critical services, and gradually expand. The ability to visualize the entire journey of a request will transform how you debug, optimize, and understand your microservices, leading to more resilient, performant, and maintainable applications. Embrace OpenTelemetry, and bring clarity to the complexity of your distributed world.

Written by
CodewithYohaFull-Stack Software Engineer with 7+ years of experience in Java, Spring Boot, and cloud architecture across AWS, Azure, and GCP. Writing production-grade engineering patterns for developers who ship real software.