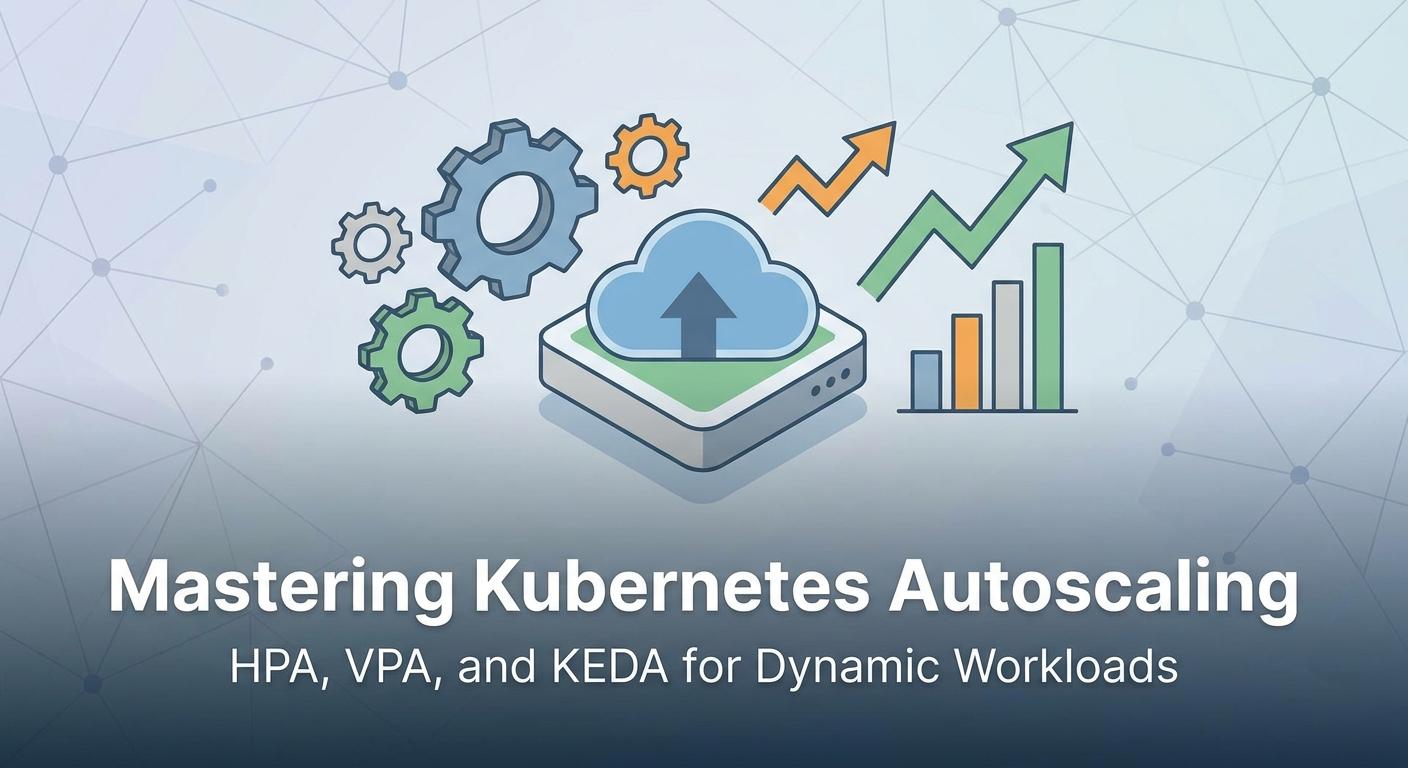
Mastering Kubernetes Autoscaling: HPA, VPA, and KEDA for Dynamic Workloads

Introduction
In the dynamic world of cloud-native applications, efficiently managing resources is paramount. Kubernetes has emerged as the de facto orchestrator for containerized workloads, but simply deploying applications isn't enough. Workloads fluctuate, sometimes experiencing massive spikes in demand, other times lying dormant. Without intelligent resource management, you face a dilemma: over-provisioning leads to wasted costs, while under-provisioning results in poor performance, latency, and even service outages.
Enter Kubernetes autoscaling. This powerful capability allows your cluster to dynamically adjust resources (pods, CPU, memory) in response to demand, ensuring optimal performance and cost efficiency. This comprehensive guide dives deep into the three pillars of Kubernetes autoscaling: Horizontal Pod Autoscaler (HPA), Vertical Pod Autoscaler (VPA), and Kubernetes Event-driven Autoscaling (KEDA). By the end, you'll understand their mechanisms, best practices, and how to combine them to master dynamic workloads.
Prerequisites
To fully grasp and experiment with the concepts discussed in this guide, you should have:
- Basic Understanding of Kubernetes: Familiarity with concepts like Pods, Deployments, Services, and
kubectl. - A Running Kubernetes Cluster: This could be a local setup like Minikube or Kind, or a managed cloud service like GKE, EKS, or AKS.
- Metrics Server Installed: Essential for HPA and VPA to gather CPU and memory utilization metrics. You can usually install it with
kubectl apply -f https://github.com/kubernetes-sigs/metrics-server/releases/latest/download/components.yaml.
Understanding Kubernetes Autoscaling Fundamentals
Autoscaling in Kubernetes is about reacting to changes in demand to maintain desired performance levels. It's broadly categorized into three types:
- Horizontal Scaling: Adjusting the number of pod replicas (HPA, KEDA).
- Vertical Scaling: Adjusting the CPU and memory resources allocated to individual pods (VPA).
- Cluster Scaling: Adjusting the number of nodes in the cluster (Cluster Autoscaler - outside the scope of this article but works in conjunction with HPA/VPA).
The Metrics Server plays a crucial role by collecting resource metrics (CPU and memory utilization) from Kubelets and exposing them via the Kubernetes API. HPA and VPA rely on these metrics to make scaling decisions.
Why is autoscaling critical? It provides:
- Cost Optimization: Pay only for the resources you actually use.
- Improved Reliability: Prevent outages due to traffic spikes.
- Better Performance: Applications always have sufficient resources.
- Operational Efficiency: Reduce manual intervention for resource management.
Horizontal Pod Autoscaler (HPA)
What is HPA?
The Horizontal Pod Autoscaler (HPA) automatically scales the number of pods in a deployment, replicaset, statefulset, or replicationcontroller based on observed CPU utilization, memory utilization, or custom/external metrics. It's designed to ensure that your application can handle varying loads by adding or removing pod replicas.
How HPA Works
The HPA controller continuously monitors the metrics specified in its configuration against the target values. When the average metric value across all pods exceeds the target, HPA increases the number of replicas. Conversely, if the average falls below the target, it decreases the replicas, respecting minReplicas and maxReplicas settings.
Key HPA fields:
minReplicas: The minimum number of pods to maintain.maxReplicas: The maximum number of pods the autoscaler can create.targetCPUUtilizationPercentage: Target average CPU utilization across all pods.targetMemoryUtilizationPercentage: Target average memory utilization across all pods.metrics: Allows specifying custom or external metrics.
Configuring HPA for CPU/Memory
First, ensure your deployment has resource requests defined, as HPA calculates utilization percentages based on these requests.
apiVersion: apps/v1
kind: Deployment
metadata:
  name: my-webapp
spec:
  selector:
    matchLabels:
      app: my-webapp
  replicas: 1
  template:
    metadata:
      labels:
        app: my-webapp
    spec:
      containers:
      - name: webapp-container
        image: nginx:latest
        resources:
          requests:
            cpu: "100m"   # Request 100 millicores
            memory: "128Mi" # Request 128 MiB
          limits:
            cpu: "200m"
            memory: "256Mi"
Now, define the HPA:
apiVersion: autoscaling/v2
kind: HorizontalPodAutoscaler
metadata:
  name: my-webapp-hpa
spec:
  scaleTargetRef:
    apiVersion: apps/v1
    kind: Deployment
    name: my-webapp
  minReplicas: 1
  maxReplicas: 10
  metrics:
  - type: Resource
    resource:
      name: cpu
      target:
        type: Utilization
        averageUtilization: 50 # Target 50% CPU utilization
  - type: Resource
    resource:
      name: memory
      target:
        type: Utilization
        averageUtilization: 70 # Target 70% Memory utilization
Apply these configurations (kubectl apply -f deployment.yaml then kubectl apply -f hpa.yaml). You can check the HPA status with kubectl get hpa my-webapp-hpa.
Advanced HPA: Custom and External Metrics
HPA can also scale based on metrics beyond CPU and memory, such as requests per second, queue length, or custom application-specific metrics. This requires installing an adapter for your metrics source (e.g., Prometheus Adapter for custom metrics, or specific external metrics adapters).
Custom Metrics Example (using Prometheus Adapter):
Assuming you have Prometheus and the Prometheus Adapter installed, you can expose custom metrics like http_requests_total from your application.
apiVersion: autoscaling/v2
kind: HorizontalPodAutoscaler
metadata:
  name: my-webapp-hpa-custom
spec:
  scaleTargetRef:
    apiVersion: apps/v1
    kind: Deployment
    name: my-webapp
  minReplicas: 1
  maxReplicas: 10
  metrics:
  - type: Pods
    pods:
      metric:
        name: http_requests_total # A metric exposed by your application's pods
      target:
        type: AverageValue
        averageValue: "100" # Target 100 requests per pod
  - type: Object
    object:
      metric:
        name: http_requests_per_second # A metric tied to a specific object (e.g., service)
      describedObject:
        apiVersion: networking.k8s.io/v1
        kind: Ingress
        name: my-webapp-ingress
      target:
        type: Value
        value: "1000" # Target 1000 requests per second for the ingress
Vertical Pod Autoscaler (VPA)
What is VPA?
While HPA adjusts the number of pods, the Vertical Pod Autoscaler (VPA) automatically adjusts the CPU and memory requests and limits for individual containers within a pod. This helps ensure that pods are neither over-provisioned (wasting resources) nor under-provisioned (leading to OOMKills or throttling).
Why VPA?
- Resource Optimization: VPA fine-tunes resource allocations, leading to better packing of pods on nodes and reduced costs.
- Performance Stability: By providing accurate resource requests, VPA helps the Kubernetes scheduler place pods on nodes with sufficient capacity, preventing resource contention.
- Prevent OOMKills: Correct memory limits prevent pods from being killed due to out-of-memory errors.
- Simplify Configuration: Developers don't need to manually guess optimal CPU/memory settings.
How VPA Works
VPA consists of three main components:
- VPA Recommender: Monitors the actual resource usage of pods over time and calculates optimal resource requests and limits.
- VPA Updater: Evicts pods that need their resource requests/limits changed and allows the VPA Admission Controller to apply the new recommendations when the pod restarts.
- VPA Admission Controller: A Mutating Admission Webhook that intercepts new pod creation requests and applies the resource recommendations from the Recommender (or Updater) to the pod's containers.
VPA Modes:
Off: VPA observes resource usage but does not apply recommendations.Initial: VPA only sets resource requests/limits when a pod is first created. It does not modify them later.Recommender: VPA observes and recommends, but doesn't apply. Useful when HPA is also present and you want to avoid conflicts.Auto: VPA automatically updates resource requests/limits during pod lifecycle (requires pod eviction and recreation).
Configuring VPA
To use VPA, you typically install the VPA components into your cluster.
apiVersion: autoscaling.k8s.io/v1
kind: VerticalPodAutoscaler
metadata:
  name: my-webapp-vpa
spec:
  targetRef:
    apiVersion: apps/v1
    kind: Deployment
    name: my-webapp
  updatePolicy:
    updateMode: "Auto" # Can be "Off", "Initial", "Recommender", "Auto"
  resourcePolicy:
    containerPolicies:
      - containerName: '*'
        minAllowed:
          cpu: "50m"
          memory: "100Mi"
        maxAllowed:
          cpu: "2"
          memory: "4Gi"
        controlledResources: ["cpu", "memory"]
Applying this (kubectl apply -f vpa.yaml) will enable VPA for my-webapp. In Auto mode, VPA will restart pods to apply new recommendations. In Recommender mode, you'd check recommendations with kubectl get vpa my-webapp-vpa -o yaml.
VPA vs. HPA: The Challenge
HPA scales horizontally based on resource utilization percentages, which are calculated relative to the pod's requested resources. VPA, on the other hand, changes those requested resources. If both are active in Auto mode for the same workload, they can conflict: VPA might increase requests, making HPA think utilization is low, leading to descaling, which is counterproductive. Generally, it's recommended to use VPA in Recommender mode when HPA is active, letting VPA provide insights while HPA manages scaling.
KEDA (Kubernetes Event-driven Autoscaling)
What is KEDA?
Kubernetes Event-driven Autoscaling (KEDA) is an open-source component that extends Kubernetes to enable event-driven autoscaling for any container workload. While HPA focuses on CPU/memory and some custom metrics, KEDA shines by scaling workloads based on a vast array of event sources, such as message queues, streaming platforms, databases, and serverless functions.
Why KEDA?
- Beyond CPU/Memory: HPA is limited for workloads that scale based on external events (e.g., number of messages in a Kafka topic, pending jobs in a queue).
- Diverse Event Sources: KEDA integrates with over 50 different scalers (AWS SQS, Azure Service Bus, Kafka, RabbitMQ, Prometheus, PostgreSQL, etc.).
- Scale to Zero: KEDA can scale deployments to zero replicas when no events are pending, and then scale them up when events arrive, significantly reducing costs for idle workloads.
- Simplifies Event-driven Architectures: Provides a unified way to manage scaling for event-driven microservices.
KEDA Architecture
KEDA introduces two main components:
- KEDA Operator: A Kubernetes controller that watches for
ScaledObjectandScaledJobcustom resources. When it detects one, it creates an HPA for the target deployment. - KEDA Scalers: These are specialized components that connect to external event sources (e.g., Kafka, RabbitMQ) and translate their metrics into a format the HPA can understand.
When events occur, a scaler fetches the relevant metric (e.g., queue length) and feeds it to the HPA, which then adjusts the pod count.
Configuring KEDA
First, you need to install KEDA in your cluster (e.g., via Helm).
helm repo add kedacore https://kedacore.github.io/charts
helm repo update
helm install keda kedacore/keda --namespace keda --create-namespace
Now, let's define a ScaledObject for a deployment, scaling based on a dummy message queue. For simplicity, we'll use a Prometheus scaler to simulate a queue depth metric.
apiVersion: apps/v1
kind: Deployment
metadata:
  name: queue-processor
  labels:
    app: queue-processor
spec:
  selector:
    matchLabels:
      app: queue-processor
  replicas: 0 # KEDA will scale from 0
  template:
    metadata:
      labels:
        app: queue-processor
    spec:
      containers:
      - name: processor
        image: busybox
        command: ["sh", "-c", "echo 'Processing message...' && sleep 5"]
        resources:
          requests:
            cpu: "50m"
memory: "64Mi"apiVersion: keda.sh/v1alpha1
kind: ScaledObject
metadata:
name: queue-processor-scaler
namespace: default
spec:
scaleTargetRef:
apiVersion: apps/v1
kind: Deployment
name: queue-processor
minReplicaCount: 0 # Allow scaling to zero
maxReplicaCount: 5
pollingInterval: 30 # How often KEDA checks the metric (seconds)
triggers:
- type: prometheus
metadata:
serverAddress: http://prometheus-kube-prometheus-prometheus.monitoring.svc.cluster.local:9090 # Replace with your Prometheus URL
metricName: queue_depth
query: 'sum(queue_depth_metric{job="my-app"})'
threshold: "5" # Scale out if queue_depth > 5
# authModes: "none" # or "basic", "bearer"In this example, KEDA will monitor the queue_depth metric from Prometheus. If the sum(queue_depth_metric) query returns a value greater than 5, KEDA will create or update an HPA to scale up the queue-processor deployment. If the value drops to 0, it will scale down to minReplicaCount (0 in this case).
Combining Autoscaling Strategies
Each autoscaling component addresses a specific dimension of scaling. For complex applications, combining them intelligently offers the most robust and cost-effective solution.
-
HPA + VPA: As discussed, direct interaction can lead to conflicts. The recommended approach is to use VPA in
Recommendermode. VPA continuously analyzes resource usage and provides optimal CPU/memory requests/limits. You can then manually update your deployment configurations based on these recommendations, allowing HPA to scale horizontally with stable, optimized resource requests.- Use Case: A microservice with highly variable traffic (HPA) but also fluctuating per-pod resource needs due to internal processing variations (VPA recommendations).
-
HPA + KEDA: This is a very common and synergistic combination. KEDA doesn't replace HPA; it leverages it. When you define a
ScaledObject, KEDA dynamically creates and manages an HPA resource for your deployment. KEDA's scalers provide the external event metrics to this HPA, allowing it to scale based on business-level events. You can even combine KEDA triggers with standard HPA resource metrics in the sameScaledObject.- Use Case: An image processing service that scales based on the number of pending images in a Kafka topic (KEDA) but also needs to react to high CPU utilization if image processing becomes more complex (HPA, potentially driven by KEDA's HPA).
-
VPA + KEDA: This combination is also powerful. KEDA handles the horizontal scaling from 0 to N based on event sources, while VPA (ideally in
RecommenderorInitialmode) ensures that the individual pods created by KEDA have optimal CPU and memory allocations. This ensures both cost-efficiency (scale to zero) and performance within each pod.- Use Case: A batch job processor that scales up based on a queue (KEDA) and each instance of the processor needs accurate resource allocation to complete its task without OOMKills or throttling (VPA).
Best Practices for Kubernetes Autoscaling
- Define Resource Requests and Limits: This is foundational. HPA relies on requests for utilization calculation, and VPA needs them to make recommendations. Limits prevent resource exhaustion.
- Monitor Everything: Use Prometheus, Grafana, or your cloud provider's monitoring tools to observe autoscaling behavior, pod resource usage, and application performance. This helps validate configurations and identify issues.
- Set
minReplicasandmaxReplicasWisely:minReplicasprevents scaling to zero if your application can't handle cold starts, whilemaxReplicasprotects against runaway scaling. - Configure
stabilizationWindowSeconds: For HPA, this parameter (part of HPA behavior inautoscaling/v2) prevents rapid scaling up and down (thrashing) by introducing a delay before scaling decisions are finalized. - Implement Graceful Shutdowns: Ensure your applications can gracefully terminate when pods are scaled down, preventing data loss or incomplete operations.
- Load Test Your Autoscaling: Simulate traffic spikes and drops in a staging environment to verify that your autoscaling configurations behave as expected.
- Use Readiness and Liveness Probes: Crucial for HPA and KEDA to ensure that newly scaled pods are healthy and ready to serve traffic before being included in metric calculations.
- Consider Cold Starts: If scaling from zero (e.g., with KEDA), be aware of the time it takes for new pods to become ready and warm up. Design your application to handle initial latency.
Common Pitfalls and Troubleshooting
- Missing Metrics Server: HPA and VPA rely on the Metrics Server. If it's not installed or healthy (
kubectl top podsfails), autoscaling won't work. - Incorrect Resource Requests/Limits: If requests are too low, HPA might scale out too aggressively. If too high, HPA might not scale enough. VPA recommendations will also be less accurate.
- Thrashing (Rapid Scaling): This often happens due to a too-small
stabilizationWindowSecondsor overly sensitive target metrics. Adjust HPA parameters or refine your custom metrics. - HPA/VPA Conflicts: Running HPA and VPA in
Automode on the same workload is generally problematic. Use VPA inRecommenderorInitialmode alongside HPA. - Application Not Scaling: Check HPA events (
kubectl describe hpa <name>), pod metrics (kubectl top pod <name>), and ensure your application is actually reporting the metrics HPA expects. - KEDA Scaler Issues: If KEDA isn't scaling, check the KEDA operator logs, ensure the
ScaledObjectconfiguration is correct, and verify connectivity to the external event source (e.g., Kafka broker, Prometheus). - Scaling to Zero Issues: Ensure your application can truly handle being scaled to zero and cold starts. Also, verify
minReplicaCount: 0in KEDA'sScaledObject.
Real-world Use Cases
Autoscaling is indispensable across a wide range of applications and scenarios:
- E-commerce Websites: HPA effectively manages fluctuating traffic during peak shopping seasons (Black Friday) by adding or removing web server pods.
- Batch Processing Jobs: KEDA can scale workers based on the number of messages in a queue (e.g., image processing, data transformation). When the queue is empty, workers scale to zero, saving costs.
- API Gateways/Microservices: HPA scales API endpoints based on request rates or latency. VPA can ensure individual microservice instances have optimal resource allocations, preventing performance bottlenecks.
- Data Ingestion Pipelines: KEDA can scale stream processors (e.g., Kafka Consumers) based on the lag in Kafka topics, ensuring real-time data processing performance.
- CI/CD Build Agents: KEDA can scale build agents based on the number of pending jobs in a Jenkins or GitLab queue, providing on-demand compute for builds.
- IoT Data Processing: Scale backend services that process sensor data using KEDA, reacting to bursts of incoming device messages.
In all these cases, autoscaling not only ensures application responsiveness but also significantly contributes to cost optimization by aligning resource consumption with actual demand.
Conclusion
Mastering Kubernetes autoscaling with HPA, VPA, and KEDA is a critical skill for anyone operating applications in a cloud-native environment. Each tool offers distinct capabilities: HPA for horizontal scaling based on resource or custom metrics, VPA for optimizing per-pod resource allocations, and KEDA for event-driven horizontal scaling from a vast array of external sources.
By understanding their individual strengths and how they can be combined, you can build resilient, cost-effective, and highly performant applications that seamlessly adapt to dynamic workloads. Remember that effective autoscaling requires careful planning, robust monitoring, and continuous iteration. Start experimenting, observe your systems, and fine-tune your configurations to unlock the full potential of dynamic resource management in Kubernetes.
Embrace autoscaling not just as a feature, but as a fundamental principle for building truly elastic and efficient cloud-native systems.
Written by
CodewithYohaFull-Stack Software Engineer with 7+ years of experience in Java, Spring Boot, and cloud architecture across AWS, Azure, and GCP. Writing production-grade engineering patterns for developers who ship real software.