eBPF-Powered Observability: Tracing Microservice Traffic with Cilium Hubble

Introduction
In the era of cloud-native applications, microservices have become the de facto architecture for building scalable, resilient, and agile systems. However, this distributed paradigm introduces significant challenges, especially when it comes to understanding how these services interact, identifying performance bottlenecks, and troubleshooting network issues. Traditional monitoring tools often struggle to provide the granular, real-time insights needed in such dynamic environments, leading to what's often termed the "observability gap."
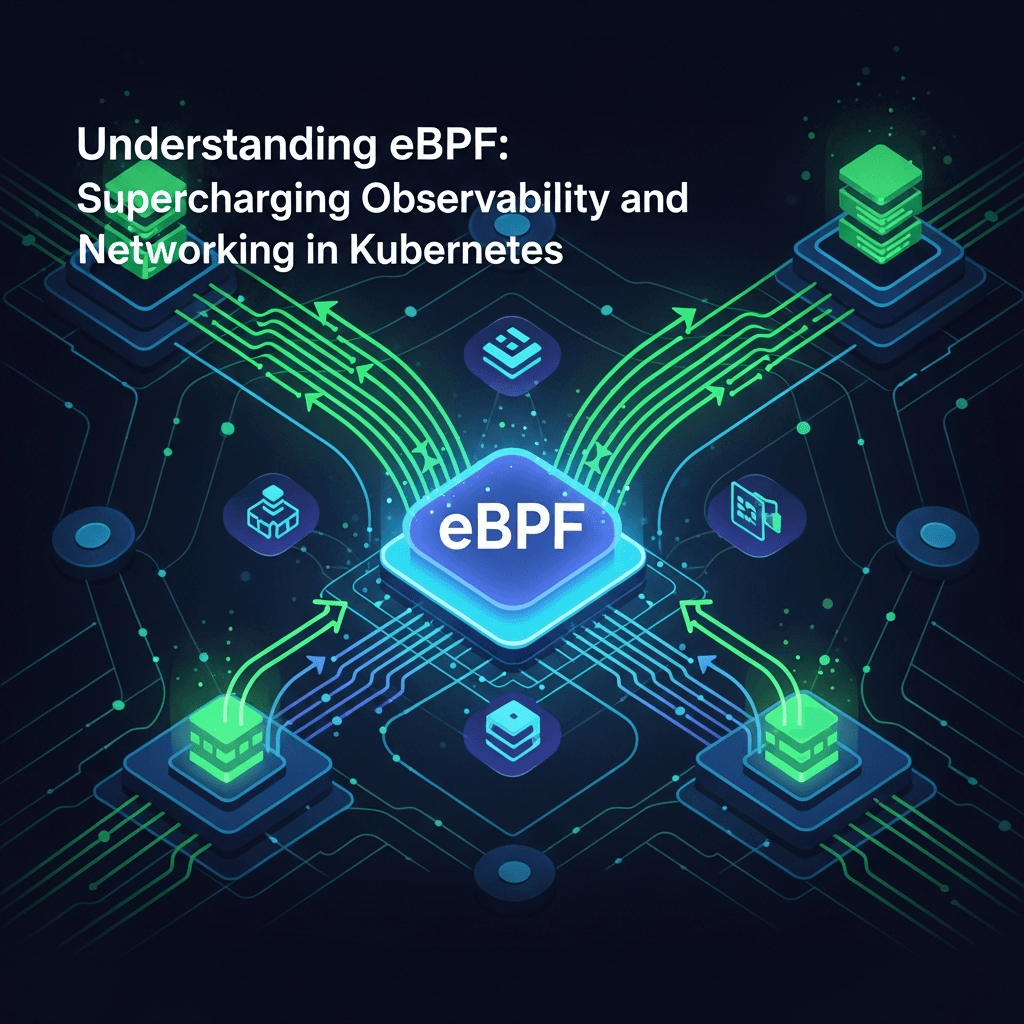
This is where eBPF (extended Berkeley Packet Filter) emerges as a game-changer. eBPF allows programs to run in the Linux kernel without changing kernel source code or loading kernel modules, providing an unprecedented level of visibility into system calls, network events, and process execution. Cilium, an open-source project, leverages eBPF to provide high-performance networking, security, and load balancing for Kubernetes. Built on top of Cilium's eBPF foundation is Hubble, a comprehensive observability platform designed specifically to bring deep visibility into microservice interactions.
This in-depth guide will walk you through the power of eBPF-powered observability with Cilium Hubble. We'll explore how Hubble can trace microservice traffic, analyze latency, and provide a holistic view of your distributed applications in Kubernetes, transforming how you monitor and troubleshoot your cloud-native infrastructure.
Prerequisites
To follow along with the practical examples in this guide, you'll need:
- A Kubernetes Cluster: Version 1.20 or newer is recommended. You can use a local cluster (e.g., Kind, Minikube) or a cloud-managed Kubernetes service.
kubectl: Configured to connect to your Kubernetes cluster.helm: The Kubernetes package manager, for installing Cilium.- Basic Understanding: Familiarity with Kubernetes concepts (Pods, Services, Deployments) and general networking principles will be beneficial.
The Observability Challenge in Microservices
Microservice architectures, while offering flexibility, introduce inherent complexity. A single user request might traverse multiple services, each running in its own container, potentially across different nodes. When an issue arises – be it a slow response, an error, or an unexpected behavior – pinpointing the exact service or network segment responsible becomes a daunting task. Traditional tools often provide fragmented views:
- Host-level metrics: CPU, memory, disk usage give little insight into inter-service communication.
- Application logs: Provide valuable data but require aggregation and correlation across many services.
- Network packet captures: Too verbose and resource-intensive for continuous monitoring in production.
- Service meshes (sidecars): Offer L7 visibility but introduce overhead and can be complex to manage, especially for network-level concerns.
This lack of a unified, real-time view of network flows and application interactions leads to longer mean time to resolution (MTTR) and reduced operational efficiency. The goal of robust observability is to answer questions like: "Which service called which?", "What was the latency between them?", "Were there any dropped packets?", and "Why did this request fail?" – all without significant performance impact.
Introducing eBPF for Network Observability
eBPF is a revolutionary technology that allows developers to run sandboxed programs in the Linux kernel. These programs can be attached to various hooks within the kernel (e.g., network events, system calls, function entries/exits) and execute safely without requiring kernel module compilation or modifying kernel source code. The power of eBPF for observability stems from several key advantages:
- Kernel-level Visibility: eBPF programs operate directly within the kernel, providing unparalleled access to low-level networking events (TCP connections, packet flows, socket operations) and application-level details (HTTP/gRPC requests) before they even leave the host.
- Performance: Being kernel-native, eBPF programs are extremely efficient, incurring minimal overhead compared to user-space agents or sidecar proxies. They process events in-kernel, reducing context switching and data copying.
- Safety: Programs are verified by an in-kernel verifier before execution, ensuring they don't crash the kernel or access unauthorized memory.
- Dynamic and Flexible: eBPF programs can be loaded, updated, and unloaded dynamically, allowing for real-time adjustments to observability needs without restarting services or hosts.
For network observability, eBPF can intercept and analyze every packet, every connection, and every application-level request without altering the data path, providing a high-fidelity, comprehensive view of all network activity.
Cilium: eBPF-Powered Networking and Security
Cilium is a cloud-native CNI (Container Network Interface) that provides networking, security, and load balancing for Kubernetes clusters, all powered by eBPF. Unlike traditional CNIs that rely on iptables or ipvs, Cilium offloads much of its logic to eBPF programs running in the kernel. This provides several benefits:
- High Performance: eBPF-based data path is highly optimized, offering superior throughput and lower latency.
- Advanced Security: Granular network policies based on identities (Pods, Deployments, Services) rather than IP addresses, capable of enforcing L3/L4 and L7 policies (e.g., allowing specific HTTP methods or paths).
- Integrated Load Balancing: Efficient service load balancing directly in eBPF, including DSR (Direct Server Return).
Cilium's eBPF foundation is crucial for Hubble. By managing the network data path and having deep kernel visibility, Cilium naturally collects a wealth of information about network flows, connection states, and even application-layer protocols. Hubble then leverages this rich data stream for its observability features.
What is Cilium Hubble?
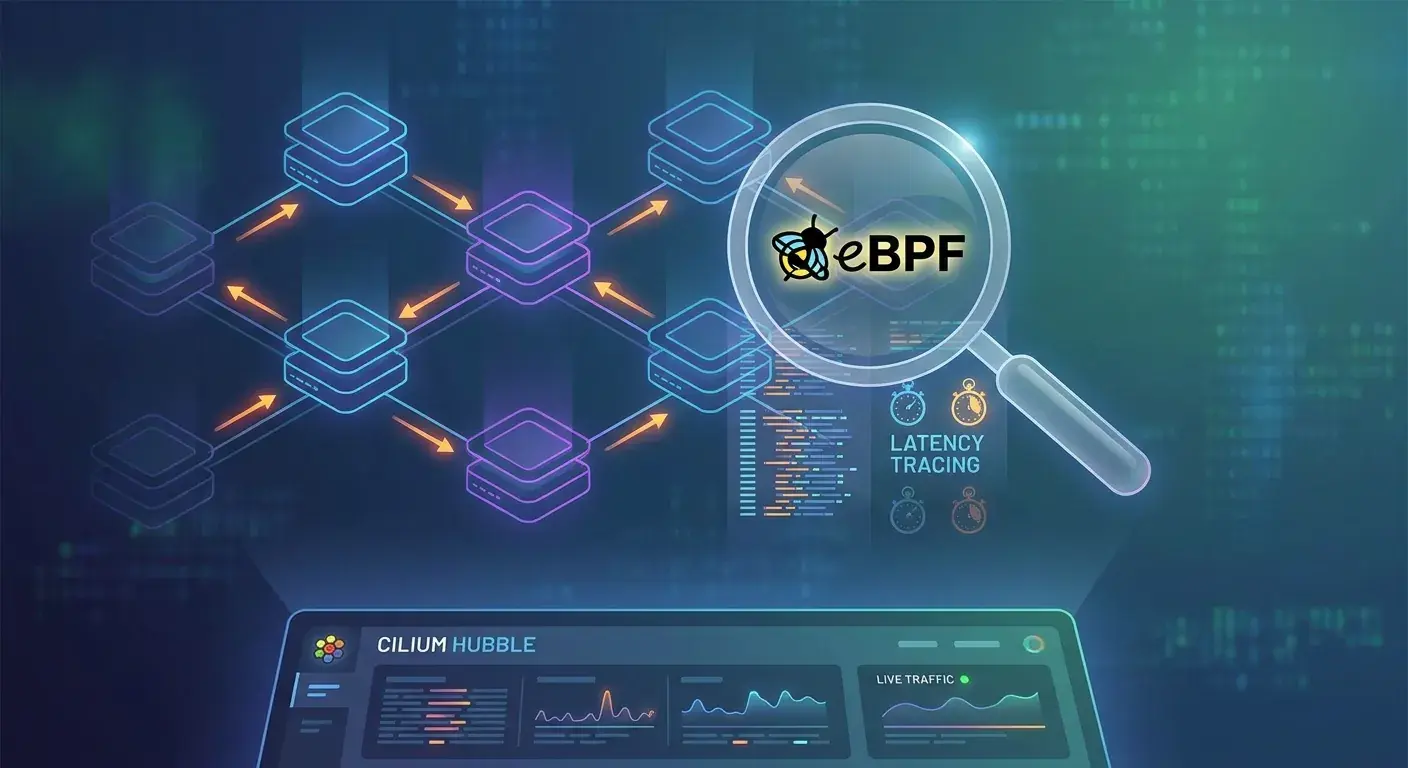
Cilium Hubble is a distributed observability platform built on top of Cilium and eBPF. It provides deep visibility into network traffic and security events within a Kubernetes cluster. Hubble processes the flow data collected by Cilium's eBPF programs and presents it in an easily consumable format, both via a command-line interface (CLI) and a powerful graphical user interface (UI).
Key features of Cilium Hubble include:
- Service Map: Automatically discovers and visualizes all service dependencies and communication flows within your cluster.
- Flow Visibility: Provides real-time and historical views of individual network flows, including source/destination IP, port, protocol, L7 protocol details (HTTP, gRPC), and status (allowed, denied, dropped).
- Latency Tracing: Captures and displays L7 request/response latency, helping to pinpoint performance bottlenecks.
- Security Policy Auditing: Shows which network policies are allowing or denying traffic.
- Metrics: Exposes Prometheus-compatible metrics for network and application-level performance.
Hubble essentially transforms raw eBPF network event data into actionable insights, making it an indispensable tool for debugging, security auditing, and performance analysis in microservice environments.
Setting Up Cilium and Hubble in Kubernetes
First, ensure you have a Kubernetes cluster and kubectl configured. We'll use Helm to install Cilium with Hubble enabled.
1. Add the Cilium Helm Repository
helm repo add cilium https://helm.cilium.io/
helm repo update
2. Install Cilium with Hubble and Hubble UI Enabled
For a basic installation, we'll enable Hubble, Hubble UI, and Prometheus metrics. Adjust --set values as needed for your environment (e.g., kubeProxyReplacement=strict for production).
helm install cilium cilium/cilium --version 1.15.4 \n --namespace kube-system \n --set enableHubble=true \n --set hubble.listenAddress=":4244" \n --set hubble.ui.enabled=true \n --set hubble.relay.enabled=true \n --set prometheus.enabled=true \n --set operator.prometheus.enabled=true \n --set l7Proxy=trueWait for all Cilium pods to be running:
kubectl get pods -n kube-system -l k8s-app=cilium
kubectl get pods -n kube-system -l k8s-app=hubble
3. Install the Hubble CLI
The Hubble CLI (hubble) is your primary tool for interacting with Hubble data from your terminal. Follow the instructions to install it for your OS:
For Linux:
curl -L --remote-name-all https://github.com/cilium/hubble/releases/latest/download/hubble-linux-amd64.tar.gz
tar xzvf hubble-linux-amd64.tar.gz
sudo mv hubble /usr/local/bin
rm hubble-linux-amd64.tar.gz
Verify installation:
hubble versionNow, connect the Hubble CLI to your cluster:
hubble port-forward & # Runs in backgroundTracing Microservice Traffic Flows with Hubble CLI
The hubble observe command is the workhorse of the Hubble CLI, allowing you to stream real-time network flows. Let's deploy a simple example application to generate some traffic.
Deploy a Sample Application
Create a demo-app.yaml file:
apiVersion: v1
kind: Namespace
metadata:
  name: demo-app
---
apiVersion: apps/v1
kind: Deployment
metadata:
  name: client
  namespace: demo-app
spec:
  replicas: 1
  selector:
    matchLabels: { app: client }
  template:
    metadata:
      labels: { app: client }
    spec:
      containers:
        - name: client
          image: curlimages/curl:latest
          command: ["sh", "-c", "while true; do curl -s server.demo-app.svc.cluster.local:8080/hello; sleep 2; done"]
---
apiVersion: apps/v1
kind: Deployment
metadata:
  name: server
  namespace: demo-app
spec:
  replicas: 1
  selector:
    matchLabels: { app: server }
  template:
    metadata:
      labels: { app: server }
    spec:
      containers:
        - name: server
          image: docker.io/cilium/json-mock:latest
          ports:
            - containerPort: 8080
              name: http
---
apiVersion: v1
kind: Service
metadata:
  name: server
  namespace: demo-app
spec:
  selector:
    app: server
  ports:
    - protocol: TCP
      port: 8080
      targetPort: 8080
Apply the manifest:
kubectl apply -f demo-app.yamlObserve All Traffic
Now, let's observe all traffic in the demo-app namespace:
hubble observe -n demo-appYou'll see a stream of events, including DNS lookups, TCP connections, and HTTP requests.
Filtering Traffic
Hubble CLI allows powerful filtering:
-
Filter by Source/Destination: Trace traffic from
clienttoserver.bash
hubble observe -f "source.pod=client,destination.pod=server" -n demo-app
*   **Filter by L7 Protocol (HTTP)**: See only HTTP requests.

```bash
hubble observe --type=l7 -f "http" -n demo-app
-
Filter by Verdict: See only denied or dropped traffic.
bash
hubble observe --verdict=DROPPED
*   **Combined Filters**: Observe HTTP requests from client to server.

```bash
hubble observe --type=l7 -f "source.pod=client,destination.pod=server,http" -n demo-app
This immediate, granular visibility is invaluable for debugging network policies, identifying unexpected communication patterns, or understanding application behavior at a low level.
Other Useful Hubble CLI Commands
hubble status: Check the status of the Hubble relay and agents.hubble top services: Shows top talkers in terms of connections or bytes.hubble top flows: Displays the most active flows.hubble get flows: Retrieve historical flows (requires Hubble to be configured for retention).
Visualizing Traffic with Hubble UI
While the CLI is powerful for quick debugging, the Hubble UI provides a rich graphical interface for exploring your cluster's network.
Accessing the Hubble UI
Since we enabled hubble.ui.enabled=true during installation, you can access the UI via port-forwarding:
kubectl port-forward -n kube-system svc/hubble-ui 8081:80 & # Or any free portNow, open your web browser and navigate to http://localhost:8081.
Exploring the Hubble UI Features
- Service Map: The most striking feature is the automatically generated service map. It visually represents all services and their communication links. You can filter by namespace, label, or verdict (e.g., show only allowed or denied flows). Clicking on a service or an arrow reveals detailed flow information.
- Flows: This section provides a live stream of network flows, similar to
hubble observe, but with rich filtering and search capabilities. You can see the full details of each flow, including L7 protocol information, source/destination identities, and latency. - Metrics: View network and application-level metrics, often integrated with Prometheus and Grafana for historical analysis.
The UI makes it incredibly easy to grasp complex microservice interactions at a glance, identify unexpected connections, or trace the path of a request through multiple services visually.
Analyzing Latency and Performance Metrics
One of Hubble's most compelling features is its ability to trace L7 (HTTP, gRPC, Kafka) request/response latency directly from the kernel. Unlike traditional methods that rely on application instrumentation or sidecars, Hubble captures this data with minimal overhead.
How Hubble Measures Latency
Cilium's eBPF programs, when configured with L7 visibility (via l7Proxy=true), can parse application-layer protocols. For HTTP, for instance, an eBPF program can observe the timestamp of an HTTP request leaving a Pod and the timestamp of its corresponding HTTP response returning to that Pod. The difference between these timestamps represents the L7 request/response latency.
Observing L7 Latency with CLI
Let's observe the HTTP latency for our demo-app:
hubble observe --type=l7 -f "http" -n demo-app --summaryAdding --summary gives a concise output, including the latency for each request:
FLOW 172.17.0.5:43884 -> server.demo-app:8080 (HTTP/1.1 GET /hello) (latency: 1.25ms)
This output immediately highlights the latency for each HTTP GET request to /hello. If you were seeing high latency, this command would quickly show you which requests are slow and their duration.
Identifying Slow Services
With Hubble UI, you can filter flows by latency or use the service map to visually identify services with high average latencies. This capability is crucial for:
- Performance Bottleneck Detection: Quickly pinpoint which microservice is introducing delays in a complex transaction.
- Service Level Objective (SLO) Monitoring: Validate if services are meeting their performance targets.
- Capacity Planning: Understand the performance characteristics of your services under load.
Real-World Use Cases
Hubble's deep visibility translates into practical benefits across various operational scenarios:
1. Troubleshooting Network Issues
- Connection Refused/Timeout: Use
hubble observeto see if TCP connections are being established. If not, check for dropped packets (--verdict=DROPPED) orconnection_refusederrors to identify network policy issues or service misconfigurations. - DNS Resolution Problems: Hubble shows DNS requests and responses. If a service can't resolve another, Hubble will reveal the failed DNS queries.
- Network Policy Debugging: Apply a network policy that denies traffic, then use
hubble observe --verdict=DENIEDto confirm if traffic is being blocked as expected and identify any unintended blocks.
2. Security Auditing and Compliance
- Unauthorized Communication: Monitor for any unexpected connections between services that shouldn't be communicating. The service map is excellent for this visual check.
- Policy Enforcement Validation: Verify that your Cilium Network Policies are correctly enforcing security boundaries by observing
DENIEDverdicts for prohibited traffic. - Zero Trust Microsegmentation: Ensure that only explicitly allowed traffic flows between services, providing a strong security posture.
3. Performance Optimization
- Identifying Latency Spikes: Use L7 latency tracing to pinpoint exactly which service calls are slow. This helps differentiate between network latency, application processing time, or external dependency delays.
- Resource Utilization Analysis: Correlate network activity and latency with CPU/memory usage to understand if performance issues are due to resource constraints or inefficient code/network paths.
4. Service Dependency Mapping
- Understanding Complex Architectures: For large microservice deployments, automatically generated service maps provide an up-to-date, accurate picture of all service dependencies, which is invaluable for onboarding new team members or architectural reviews.
- Impact Analysis: Before deploying a change, use the service map to understand all upstream and downstream dependencies, helping to predict potential impacts.
Best Practices for eBPF Observability with Hubble
To maximize the benefits of Cilium Hubble, consider these best practices:
- Start with Namespace-Level Observability: When troubleshooting, narrow your focus using
hubble observe -n <namespace>before expanding to cluster-wide views. This reduces noise and helps you concentrate on relevant traffic. - Leverage Filtering: Master Hubble CLI's filtering capabilities (
-f,--type,--verdict) to quickly isolate specific traffic patterns, protocols, or issues. This is more efficient than sifting through raw logs. - Integrate with Prometheus and Grafana: Enable Cilium and Hubble Prometheus metrics (
--set prometheus.enabled=true,--set operator.prometheus.enabled=true) to collect historical data. Build Grafana dashboards to visualize trends, set up alerts for anomalies, and correlate network metrics with application performance. - Automate Deployment: Include Cilium and Hubble installation in your GitOps or infrastructure-as-code pipelines to ensure consistent deployment and configuration across environments.
- Understand L7 Visibility Impact: While highly beneficial, L7 parsing consumes slightly more resources than L3/L4. Enable it only where needed or for critical services if resource constraints are tight (though eBPF's efficiency generally makes this a minor concern).
- Regularly Review Service Maps: Periodically check the Hubble UI's service map for unexpected connections or changes in dependencies, which could indicate misconfigurations or potential security issues.
Common Pitfalls and Troubleshooting
While robust, you might encounter some issues when working with Cilium and Hubble:
- Cilium/Hubble Pods Not Ready: Check
kubectl get pods -n kube-system -l k8s-app=ciliumandkubectl get pods -n kube-system -l k8s-app=hubbleand review their logs (kubectl logs -n kube-system <pod-name>). Common issues include network configuration conflicts or insufficient resources. hubble port-forwardFails: Ensure thehubble-relayservice is running inkube-system. If it is, check for port conflicts on your local machine.- No Flows in Hubble UI/CLI: Verify that
enableHubble=truewas set during Cilium installation. Check Cilium agent logs for eBPF errors or warnings. Ensure your applications are actually generating network traffic. - Incomplete L7 Visibility: If you're not seeing HTTP/gRPC details, ensure
l7Proxy=truewas set during Cilium installation. Also, verify that the traffic is indeed HTTP/gRPC on standard ports or ports that Cilium is configured to inspect. - RBAC Issues: If you're using a service account or non-admin user, ensure it has sufficient RBAC permissions to access Cilium and Hubble resources (e.g.,
cilium.ioAPI groups,hubble-relayservice). - Kernel Version Compatibility: While eBPF is well-supported, very old or highly customized Linux kernels might have compatibility issues. Cilium generally requires a kernel version 4.9+ but recommends 5.10+ for optimal performance and features.
Conclusion
The complexity of modern microservice architectures demands advanced observability tools that can provide deep, real-time insights without compromising performance. Cilium Hubble, powered by the revolutionary eBPF technology, rises to this challenge by offering unparalleled visibility into network flows, service dependencies, and application-level latency directly from the Linux kernel.
By leveraging Hubble's CLI and intuitive UI, developers and operators can troubleshoot network issues faster, enforce and audit security policies with greater confidence, optimize application performance, and gain a comprehensive understanding of their distributed systems. Embracing eBPF-powered observability with Cilium Hubble is not just about adding another monitoring tool; it's about fundamentally transforming your approach to understanding and managing cloud-native applications.
Start your journey today by deploying Cilium and Hubble in your Kubernetes cluster and unlock the full potential of kernel-native observability for your microservices.
Written by
CodewithYohaFull-Stack Software Engineer with 7+ years of experience in Java, Spring Boot, and cloud architecture across AWS, Azure, and GCP. Writing production-grade engineering patterns for developers who ship real software.