Introduction
In today's fast-paced digital landscape, businesses demand immediate insights to make critical decisions, detect anomalies, and respond to dynamic market conditions. Traditional data warehousing solutions, often designed for batch processing, struggle to keep up with the velocity and volume of real-time event streams. The delay between an event occurring and its reflection on a dashboard can render the insights stale, impacting business agility and competitive advantage.
Enter the powerful duo: Apache Kafka and ClickHouse. Apache Kafka, a distributed streaming platform, acts as the central nervous system for your data, handling high-throughput event ingestion and durable storage. ClickHouse, a lightning-fast columnar analytical database, is purpose-built for real-time OLAP (Online Analytical Processing) queries over massive datasets. Together, they form an unbeatable stack for constructing real-time dashboards that provide immediate, actionable intelligence.
This comprehensive guide will walk you through the architecture, setup, implementation, and best practices for building robust real-time dashboards using Apache Kafka and ClickHouse. By the end, you'll have a clear understanding of how to leverage these technologies to transform raw event data into dynamic, insightful visualizations.
Why Real-Time Dashboards Are Essential
The ability to monitor and analyze data as it's generated is no longer a luxury but a necessity for many organizations. Real-time dashboards offer significant advantages across various domains:
- Immediate Decision Making: Business operations teams can react instantly to changes in sales, inventory, or user behavior, optimizing strategies on the fly.
- Proactive Anomaly Detection: Identify fraudulent transactions, system outages, or unusual patterns in user activity as they happen, enabling rapid mitigation.
- Enhanced User Experience: Personalize recommendations, adjust content delivery, or offer dynamic pricing based on real-time user interactions.
- Operational Monitoring: Track application performance, infrastructure health, and security events in real-time, preventing potential issues before they escalate.
- Competitive Advantage: Gain insights faster than competitors, allowing for quicker adaptation to market shifts and emerging trends.
From financial services needing instant fraud detection to e-commerce platforms optimizing conversion rates, the demand for real-time data processing and visualization is universal.
Understanding the Core Technologies
Before diving into the implementation, let's briefly review the foundational technologies:
Apache Kafka: The Real-Time Data Backbone
Apache Kafka is a distributed streaming platform capable of handling trillions of events per day. It's designed for high-throughput, low-latency, and fault-tolerant data ingestion and processing. Key concepts include:
- Producers: Applications that publish (write) data to Kafka topics.
- Consumers: Applications that subscribe to and read data from Kafka topics.
- Topics: Categories or feeds to which records are published. Topics are partitioned for scalability and parallelism.
- Brokers: Kafka servers that store topic partitions and serve requests from producers and consumers.
- Zookeeper: Historically used by Kafka for metadata management, leader election, and cluster coordination (though Kafka is moving away from this dependence).
Kafka's durability and ability to replay data make it an ideal choice for the first layer of a real-time analytics pipeline.
ClickHouse: The Analytical Powerhouse
ClickHouse is an open-source, column-oriented database management system (DBMS) for online analytical processing (OLAP). It was developed by Yandex for its web analytics product, Yandex.Metrica, and is designed for extreme performance on analytical queries. Its key features include:
- Columnar Storage: Data is stored column by column, enabling highly efficient compression and faster query execution for analytical workloads, as only relevant columns need to be read from disk.
- Vectorized Query Execution: Operations are performed on entire vectors (chunks of columns) at once, leveraging CPU cache and SIMD instructions for massive parallelism.
- Massive Parallel Processing (MPP): Designed to scale horizontally across multiple nodes, distributing data and query processing.
- Rich SQL Dialect: Supports a wide range of SQL functions, including advanced aggregations, array functions, and window functions.
- Materialized Views: Allows pre-computation of aggregations, significantly speeding up common queries.
ClickHouse excels at ad-hoc analytical queries over petabytes of data, making it a perfect fit for powering real-time dashboards.
Architectural Overview: Kafka + ClickHouse Synergy
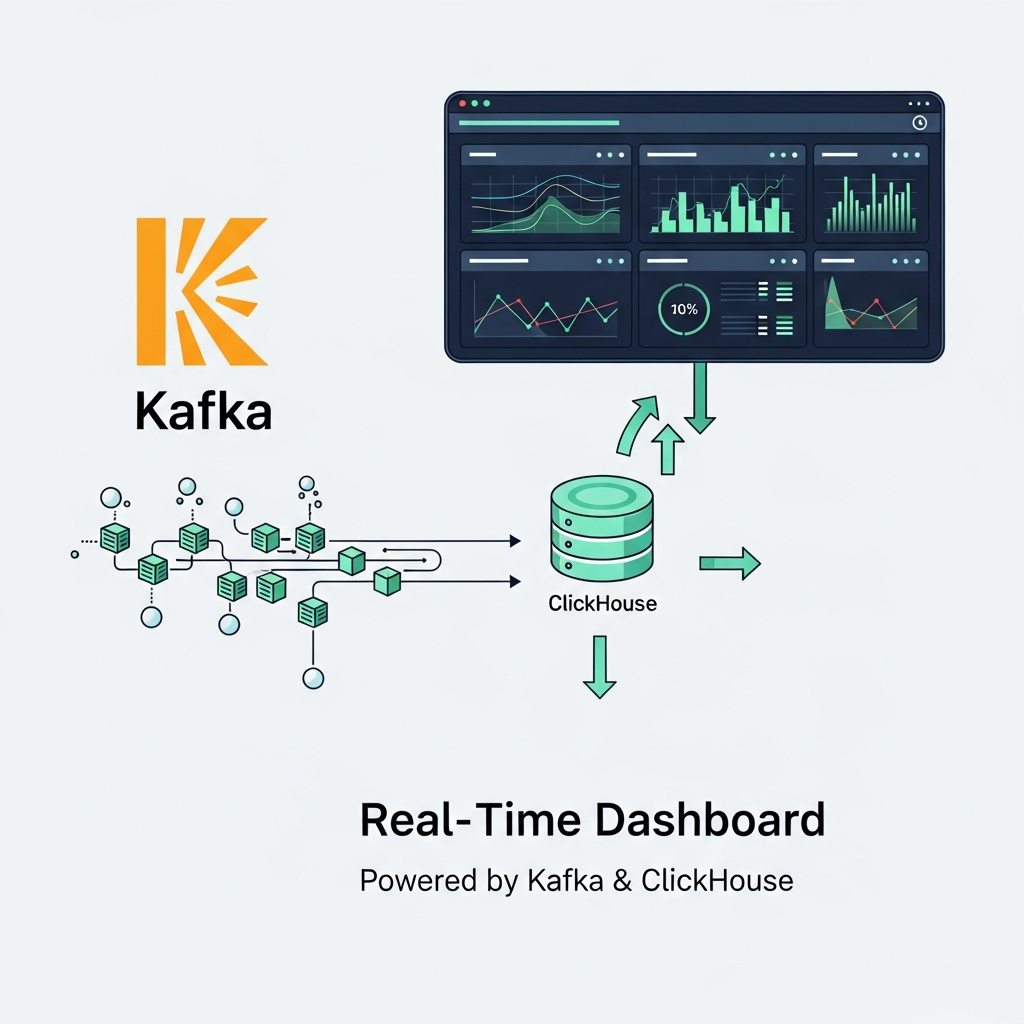
The typical architecture for real-time dashboards using Kafka and ClickHouse involves the following flow:
- Event Generation: Your applications (web servers, mobile apps, IoT devices, etc.) generate event data.
- Kafka Ingestion: These events are published by producers to specific topics in Apache Kafka.
- ClickHouse Ingestion: ClickHouse acts as a consumer, ingesting data directly from Kafka topics.
- Data Transformation & Persistence: As data flows into ClickHouse, it can be transformed, aggregated, and persisted into optimized analytical tables, often using materialized views.
- Dashboarding: BI tools (e.g., Grafana, Apache Superset) connect to ClickHouse to execute lightning-fast analytical queries and visualize the real-time data.
This architecture provides a robust, scalable, and high-performance pipeline for transforming raw event streams into actionable insights almost instantaneously.
Prerequisites
To follow along with the practical examples, you'll need:
- A basic understanding of Linux command-line operations.
- Docker and Docker Compose installed on your system.
- Familiarity with SQL.
- Python 3.x for writing producer applications (or Java/Go, depending on your preference).
Setting Up Your Environment (Docker Compose)
We'll use Docker Compose to quickly set up Kafka, Zookeeper, and ClickHouse locally. Create a file named docker-compose.yml:
version: '3.8'

services:
  zookeeper:
    image: confluentinc/cp-zookeeper:7.5.0
    hostname: zookeeper
    container_name: zookeeper
    ports:
      - "2181:2181"
    environment:
      ZOOKEEPER_CLIENT_PORT: 2181
      ZOOKEEPER_TICK_TIME: 2000

  kafka:
    image: confluentinc/cp-kafka:7.5.0
    hostname: kafka
    container_name: kafka
    ports:
      - "9092:9092"
    environment:
      KAFKA_BROKER_ID: 1
      KAFKA_ZOOKEEPER_CONNECT: zookeeper:2181
      KAFKA_ADVERTISED_LISTENERS: PLAINTEXT://kafka:29092,PLAINTEXT_HOST://localhost:9092
      KAFKA_LISTENER_SECURITY_PROTOCOL_MAP: PLAINTEXT:PLAINTEXT,PLAINTEXT_HOST:PLAINTEXT
      KAFKA_INTER_BROKER_LISTENER_NAME: PLAINTEXT
      KAFKA_OFFSETS_TOPIC_REPLICATION_FACTOR: 1
      KAFKA_GROUP_INITIAL_REBALANCE_DELAY_MS: 0
    depends_on:
      - zookeeper

  clickhouse:
    image: clickhouse/clickhouse-server:24.3
    hostname: clickhouse
    container_name: clickhouse
    ports:
      - "8123:8123" # HTTP interface
      - "9000:9000" # Native client interface
    ulimits:
      nofile:
        soft: 262144
        hard: 262144
    # Uncomment for persistent data (create ./clickhouse_data folder first)
    # volumes:
    #   - ./clickhouse_data:/var/lib/clickhouse
    environment:
      CLICKHOUSE_USER: default
      CLICKHOUSE_PASSWORD:
      CLICKHOUSE_DB: default
    depends_on:
      - kafka
Save this file and run docker-compose up -d in your terminal. This will spin up Zookeeper, Kafka, and ClickHouse instances.
Step 1: Ingesting Data into Kafka
First, we need to create a Kafka topic where our event data will reside. Connect to the Kafka container and create a topic:
docker exec -it kafka kafka-topics --create --topic user_events --bootstrap-server localhost:29092 --partitions 1 --replication-factor 1Next, let's write a simple Python producer to simulate real-time user events (e.g., website clicks, page views). Install the confluent-kafka library: pip install confluent-kafka.
Create a Python script, kafka_producer.py:
import json
import time
import random
from datetime import datetime
from confluent_kafka import Producer

# Kafka configuration
KAFKA_BROKER = 'localhost:9092'
KAFKA_TOPIC = 'user_events'

def delivery_report(err, msg):
    """ Called once for each message produced to indicate delivery result. """
    if err is not None:
        print(f"Message delivery failed: {err}")
    else:
        print(f"Message delivered to topic {msg.topic()} [{msg.partition()}] at offset {msg.offset()}")

def generate_event():
    user_ids = [f"user_{i}" for i in range(1, 101)]
    event_types = ["page_view", "add_to_cart", "purchase", "login", "logout"]
    product_ids = [f"prod_{i}" for i in range(1, 51)]
    regions = ["North", "South", "East", "West", "Central"]

    event = {
        "event_time": datetime.now().isoformat(),
        "user_id": random.choice(user_ids),
        "event_type": random.choice(event_types),
        "product_id": random.choice(product_ids) if random.random() < 0.7 else None, # 70% chance of product_id
        "quantity": random.randint(1, 5) if random.random() < 0.3 else None, # 30% chance of quantity
        "price": round(random.uniform(5.0, 500.0), 2) if random.random() < 0.2 else None, # 20% chance of price
        "region": random.choice(regions),
        "session_id": f"sess_{random.randint(1000, 9999)}"
    }
    return json.dumps(event)

if __name__ == '__main__':
    producer_conf = {
        'bootstrap.servers': KAFKA_BROKER
    }

    producer = Producer(producer_conf)

    print(f"Producing messages to topic {KAFKA_TOPIC}...")
    try:
        while True:
            event_message = generate_event()
            producer.produce(
                KAFKA_TOPIC,
                key=None,
                value=event_message.encode('utf-8'),
                callback=delivery_report
            )
            producer.poll(0) # Serve delivery callback queue.
            time.sleep(random.uniform(0.1, 0.5)) # Send events every 100-500ms

    except KeyboardInterrupt:
        print("\nStopping producer.")
    finally:
        producer.flush() # Wait for any outstanding messages to be delivered and report success/failure.
Run this script: python kafka_producer.py. You'll see messages being produced to your Kafka topic.
Step 2: Designing Your ClickHouse Schema for Real-Time Analytics
Schema design in ClickHouse is crucial for performance. Given its columnar nature, you want to optimize for queries that select a few columns over many rows. For real-time dashboards, MergeTree family tables are generally the best choice. For our user_events data, we'll use a simple MergeTree table.
Connect to ClickHouse via the client: docker exec -it clickhouse clickhouse-client.
Create the database and table:
CREATE DATABASE IF NOT EXISTS analytics;

USE analytics;

CREATE TABLE user_events_raw (
    event_time         DateTime64(3) COMMENT 'Timestamp of the event',
    user_id            String        COMMENT 'ID of the user',
    event_type         LowCardinality(String) COMMENT 'Type of event (e.g., page_view, purchase)',
    product_id         Nullable(String) COMMENT 'ID of the product, if applicable',
    quantity           Nullable(UInt16) COMMENT 'Quantity, if applicable',
    price              Nullable(Decimal64(2)) COMMENT 'Price, if applicable',
    region             LowCardinality(String) COMMENT 'Geographic region',
    session_id         String        COMMENT 'Session ID'
)
ENGINE = MergeTree()
ORDER BY (event_time, user_id, event_type) -- Primary key for sorting data on disk
PARTITION BY toYYYYMM(event_time) -- Partitioning by month for efficient data pruning
SETTINGS index_granularity = 8192;
Schema Design Considerations:
DateTime64(3): For millisecond precision timestamps, ideal for event data.LowCardinality(String): Use for columns with a limited number of distinct values (e.g.,event_type,region). This can significantly improve compression and query performance.Nullable(): For optional fields (product_id,quantity,price).Decimal64(2): For precise monetary values.ORDER BY: Defines the physical sorting order of data within each part. Crucial for query performance, especially withWHEREclauses andGROUP BYon these columns.PARTITION BY: Helps prune data quickly for queries spanning specific time ranges.toYYYYMM(event_time)is common for time-series data.MergeTree: The most flexible and widely used table engine, suitable for high-load analytical tasks.
Step 3: Streaming Data from Kafka to ClickHouse
ClickHouse offers a powerful built-in Kafka table engine, which allows it to directly consume data from Kafka topics. This is often the simplest and most performant way to get data into ClickHouse for real-time dashboards.
Using ClickHouse's Kafka Engine Table
First, create a Kafka engine table that points to your Kafka topic:
USE analytics;

CREATE TABLE user_events_kafka (
    event_time         DateTime64(3),
    user_id            String,
    event_type         LowCardinality(String),
    product_id         Nullable(String),
    quantity           Nullable(UInt16),
    price              Nullable(Decimal64(2)),
    region             LowCardinality(String),
    session_id         String
)
ENGINE = Kafka()
SETTINGS
    kafka_broker_list = 'kafka:29092', -- Or 'localhost:9092' if connecting from outside docker-compose network
    kafka_topic_list = 'user_events',
    kafka_group_name = 'clickhouse_consumer_group',
    kafka_format = 'JSONEachRow',
    kafka_num_consumers = 1,
    kafka_max_block_size = 100000,
    kafka_skip_broken_messages = 10;
Explanation of Kafka Engine Settings:
kafka_broker_list: Your Kafka broker's address. Usekafka:29092from within the Docker Compose network.kafka_topic_list: The Kafka topic(s) to consume from.kafka_group_name: The consumer group name. ClickHouse will manage offsets within this group.kafka_format: Specifies the data format.JSONEachRowis perfect for our JSON events.kafka_num_consumers: Number of consumer threads. Should be less than or equal to the number of topic partitions.kafka_max_block_size: How many messages to read in a single batch.kafka_skip_broken_messages: Skips a specified number of broken messages if they cannot be parsed.
This user_events_kafka table is virtual; it doesn't store data but rather acts as a bridge to Kafka. To persist and transform the data, we use a Materialized View.
USE analytics;

CREATE MATERIALIZED VIEW user_events_mv TO user_events_raw
AS
SELECT
    event_time,
    user_id,
    event_type,
    product_id,
    quantity,
    price,
    region,
    session_id
FROM user_events_kafka;
Now, as messages arrive in the user_events Kafka topic, they will be automatically ingested, parsed, and inserted into the user_events_raw table via the user_events_mv materialized view. You can query user_events_raw to see the data arriving.
SELECT count() FROM analytics.user_events_raw;
SELECT * FROM analytics.user_events_raw LIMIT 10;
Alternative: Custom Consumer Application
While the Kafka engine is excellent for direct ingestion, you might opt for a custom consumer application (e.g., written in Python, Java, Go) if you need:
- Complex ETL: Data enrichment from external sources, intricate transformations not easily expressed in SQL.
- Schema Enforcement/Validation: More rigorous checks before data lands in ClickHouse.
- Custom Error Handling: Specific logic for malformed messages or upstream system failures.
- Integration with other systems: Fan-out data to multiple destinations.
For most real-time dashboarding scenarios, the ClickHouse Kafka engine and materialized views are sufficient and recommended for their simplicity and performance.
Step 4: Querying Data for Real-Time Dashboards
Once data is flowing into user_events_raw, you can run powerful analytical queries. ClickHouse's speed makes these queries suitable for direct integration with dashboarding tools.
Here are some example queries you might use for a real-time dashboard:
1. Total Events per Minute:
SELECT
    toStartOfMinute(event_time) AS minute,
    count() AS total_events
FROM analytics.user_events_raw
WHERE event_time >= now() - INTERVAL 1 HOUR -- Last hour
GROUP BY minute
ORDER BY minute ASC;
2. Top 5 Event Types in the Last 15 Minutes:
SELECT
    event_type,
    count() AS event_count
FROM analytics.user_events_raw
WHERE event_time >= now() - INTERVAL 15 MINUTE
GROUP BY event_type
ORDER BY event_count DESC
LIMIT 5;
3. Daily Unique Users:
SELECT
    toDate(event_time) AS day,
    uniq(user_id) AS unique_users
FROM analytics.user_events_raw
WHERE event_time >= now() - INTERVAL 7 DAY
GROUP BY day
ORDER BY day ASC;
4. Total Purchases and Revenue by Region in the Last Hour:
SELECT
    region,
    countIf(event_type = 'purchase') AS total_purchases,
    sumIf(price * quantity, event_type = 'purchase') AS total_revenue
FROM analytics.user_events_raw
WHERE event_time >= now() - INTERVAL 1 HOUR
GROUP BY region
ORDER BY total_revenue DESC;
These queries demonstrate ClickHouse's ability to perform fast aggregations and time-series analysis, which are fundamental for real-time dashboards.
Best Practices for Production Systems
Building a real-time pipeline requires careful consideration of several factors for production readiness:
-
Schema Evolution: Plan for changes in your event data schema. ClickHouse supports adding new columns with
ALTER TABLE ADD COLUMN. For complex changes, consider using a schema registry (like Confluent Schema Registry with Avro) in Kafka, and a robust ETL process before loading into ClickHouse. -
Data Partitioning (Kafka & ClickHouse): Align Kafka topic partitions with ClickHouse table partitioning. For ClickHouse, partition by time (e.g.,
toYYYYMMDD(event_time)) for efficient data pruning on time-based queries. Ensure yourORDER BYclause is well-chosen to optimize common query patterns. -
Monitoring: Implement comprehensive monitoring for both Kafka and ClickHouse. For Kafka, track consumer lag, message throughput, and broker health. For ClickHouse, monitor query performance, disk usage, CPU, and memory, leveraging
system.*tables and logs. -
Scalability: Kafka scales horizontally by adding more brokers and partitions. ClickHouse scales by adding more nodes to a cluster. Plan your scaling strategy based on expected data volume and query load.
-
Data Retention: Define clear data retention policies for both systems. Kafka topics can be configured to retain data for a specific duration. In ClickHouse, use
TTL(Time To Live) clauses on yourMergeTreetables to automatically delete old data, managing storage costs and query performance.sqlALTER TABLE user_events_raw MODIFY TTL event_time + INTERVAL 3 MONTH; -
Security: Secure your Kafka and ClickHouse deployments with appropriate authentication (e.g., SASL for Kafka, user/password for ClickHouse) and authorization mechanisms. Encrypt data in transit and at rest.
-
Idempotency: Ensure that your data ingestion process into ClickHouse is idempotent to handle potential duplicate messages from Kafka (e.g., during consumer rebalances).
ReplacingMergeTreeorSummingMergeTreeengines can help with this, or implement deduplication logic in your materialized views or consumer applications.
Common Pitfalls and How to Avoid Them
Even with powerful tools, mistakes can lead to performance bottlenecks or data integrity issues:
- Misconfiguring Kafka Consumer Offsets: If ClickHouse (or any consumer) doesn't commit its offsets correctly, it might reprocess messages, leading to duplicates, or skip messages, leading to data loss. The ClickHouse Kafka engine handles this automatically, but be aware if building custom consumers.
- Inefficient ClickHouse Schema Design: Using
Stringfor high-cardinality IDs that are rarely filtered or joined, or not usingLowCardinalityfor suitable columns, can bloat storage and slow down queries. Not choosing an optimalORDER BYclause is a common mistake. - Lack of Indexing: While ClickHouse doesn't have traditional B-tree indexes, the
ORDER BYclause acts as a sparse primary index. If your common queries filter on columns not in theORDER BYkey, they will perform full scans. Consider creating aMaterialized Viewthat aggregates and re-orders data for specific dashboards. - Ignoring Materialized View Refresh Rates: Materialized views in ClickHouse are incremental, meaning they process new data as it arrives. If the underlying Kafka engine consumer lags, the materialized view will also lag. Monitor consumer lag to ensure dashboards remain real-time.
- Not Handling Data Quality Issues: Malformed JSON messages can cause the ClickHouse Kafka engine to stop processing a partition (unless
kafka_skip_broken_messagesis configured). Implement robust data validation and error handling, perhaps by routing bad messages to a Dead Letter Queue (DLQ) topic in Kafka. - Over-reliance on
SELECT *: Always select only the columns you need. ClickHouse's columnar storage makes this particularly impactful on performance.
Integrating with Dashboarding Tools
Once your data pipeline is robustly established, connecting to dashboarding tools is straightforward. ClickHouse offers various connectivity options:
- HTTP Interface: Most BI tools can connect via HTTP. This is often the simplest way to get started.
- Native TCP Protocol: For higher performance, use tools that support ClickHouse's native TCP protocol.
- JDBC/ODBC Drivers: Standard drivers allow connectivity from a wide range of tools like Grafana, Apache Superset, Tableau, Power BI, and Looker.
For instance, with Grafana, you can easily add a ClickHouse data source, write your SQL queries, and build dynamic, real-time visualizations directly from your user_events_raw table or aggregated materialized views.
Conclusion
Building real-time dashboards with Apache Kafka and ClickHouse provides an unparalleled combination of scalability, performance, and flexibility. Kafka ensures that your event data is ingested reliably and at high velocity, while ClickHouse transforms that stream into actionable intelligence with sub-second query responses, even on massive datasets.
By following the architectural patterns, best practices, and avoiding common pitfalls outlined in this guide, you can empower your organization with the immediate insights needed to thrive in today's data-driven world. The journey from raw events to real-time decisions has never been more efficient or effective. Start experimenting with this powerful stack today, and unlock the true potential of your streaming data.

Written by
CodewithYohaFull-Stack Software Engineer with 7+ years of experience in Java, Spring Boot, and cloud architecture across AWS, Azure, and GCP. Writing production-grade engineering patterns for developers who ship real software.